Table of Contents
Unveiling New Reports in Jira: An Introduction and Examples
Sometimes the default fields in Jira can’t tell the whole story. By adding custom fields that you can control with Jira Automation, you can help your company uncover more Jira reports that could enhance the performance of your team using the newly collected data.
Explore this list of sample Jira custom fields in JSM to enhance your team’s performance tracking. Additionally, discover ideas for building Jira reports using these fields.
| Custom Field | Field Type | KPI | Gains |
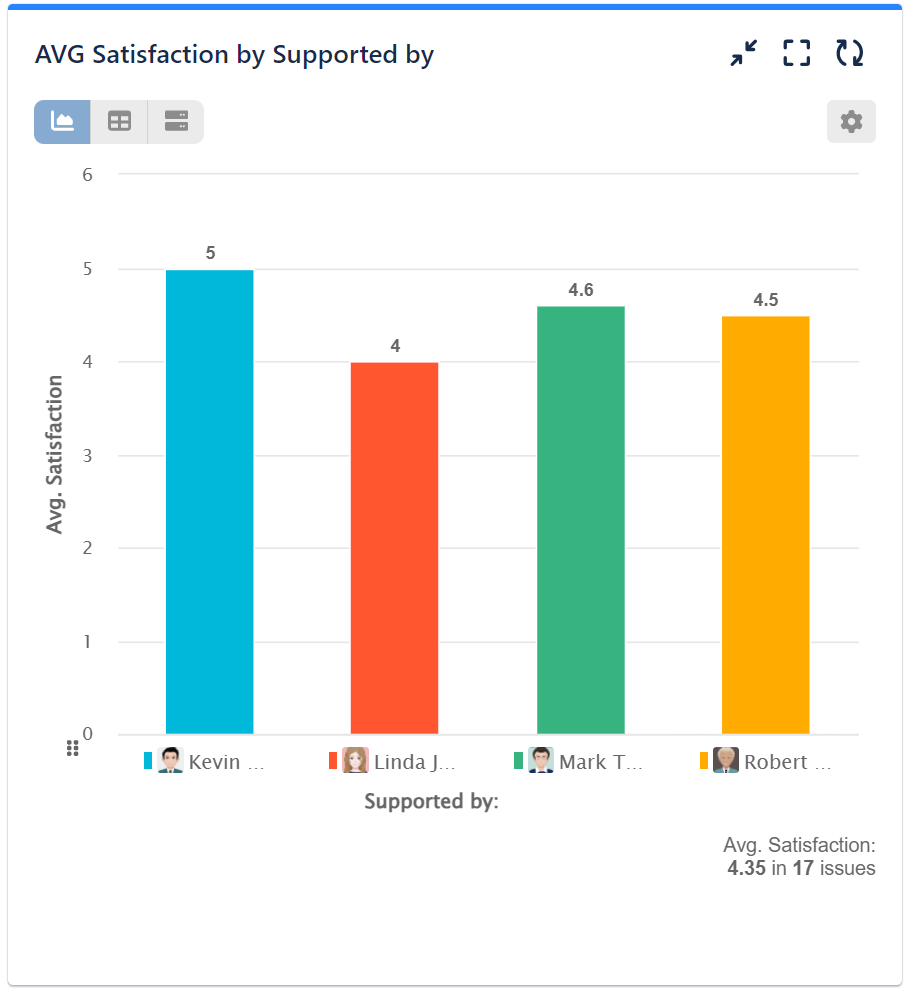
| Supported by | User Picker | Customer Satisfaction by ‘Issue owner’ | This entails the precise identification of key contributors within the team or the ‘issue owner’ – the individual responsible for the overall customer experience from initiation to issue resolution. Since the last assignee may not necessarily be the ‘issue owner,’ consider creating a user-picker custom field to capture this specific user for certain processes. |
| Support started* | Date Time Picker | First Response Time (FRT)– A critical KPI playing a crucial role in customer satisfaction and SLA compliance. | To enhance the accuracy of FRT calculation or address specific scenarios, consider using a custom field. This can be particularly useful for certain issue types, reporters, and other specific cases. Please be aware that the native ‘Time to first response’ Jira gadget specifically captures the first comment added to an issue by someone other than the reporter. Transitions or attachments do not register an entry visible to the gadget. |
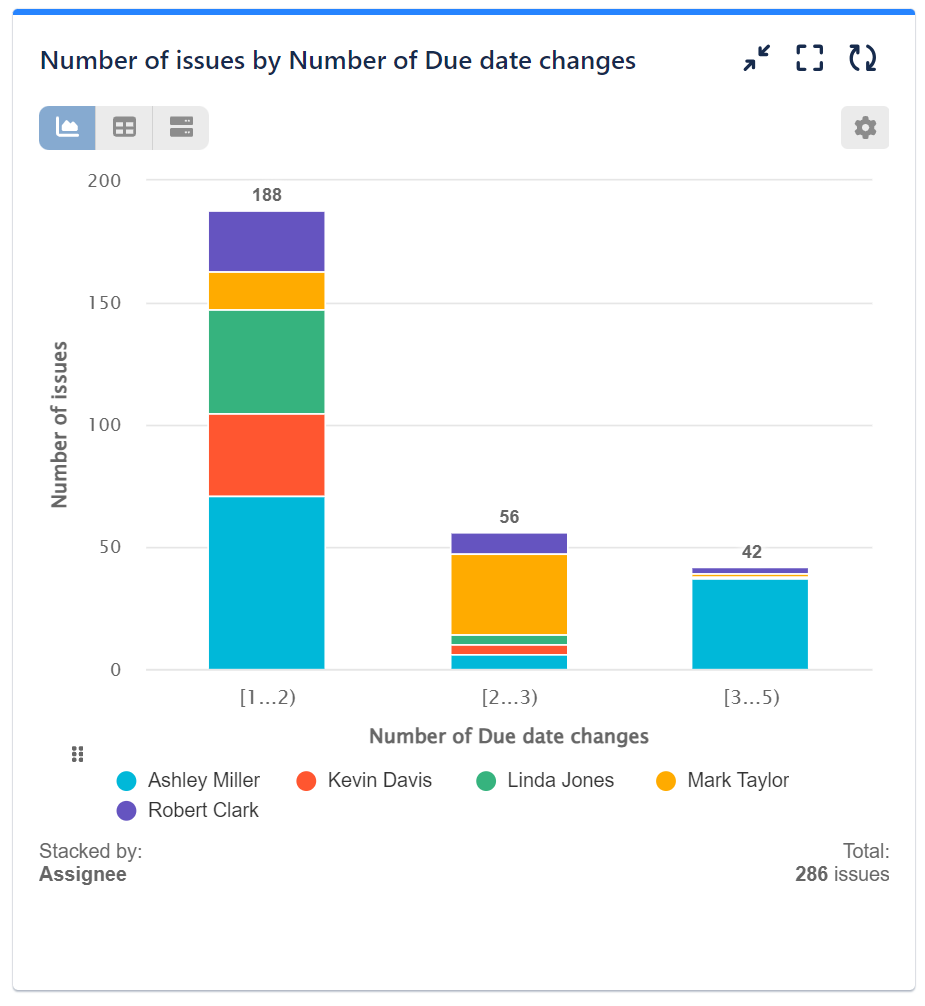
| Number of Due date changes | Numerical field | Average number of due date changes by project / issue type / priority, etc. | Track and analyze issues with changed Due dates. Assess the precision of predictions, evaluate adherence to due dates, and monitor the ratio of on-time deliveries. |
Here are 2 sample custom fields for your QA team in Jira Software:
| Custom Field | Field Type | KPI | Gains |
| Test Iterations | Numerical field | Decrease cycles in status | A quantitative measure for continuous improvement. Aids in optimizing testing processes and reducing cycles. |
| Tested by | User Picker | Open issues over time in status ‘Testing’ by ‘Tested by’ | Monitoring the testing team workload. |
You can easily track other Jira data, such as Review Iterations, Reviewed By, Reopen Iterations, Reopened By, or anything else you feel would best suit your workflow. We provide a comprehensive library of KPI examples for your Jira dashboard for inspiration.
Step 1: Crafting New Jira Custom Fields
Creating new custom fields in Jira is easy. Navigate to the upper right cogwheel, click on Issues, select Custom fields, choose Create custom field, and search for the right field type. Configure the Name and description of your new custom field, and associate the field with a screen and project of your choice.
Step 2: Streamlining Data Collection With Jira Automation or Post Functions
To gather data from your new custom fields, you can employ Jira Automation rules or integrate additional Post Functions into the Workflow events of your project. This article will thoroughly explore both options. It’s crucial to highlight that the second method involving post functions comes with a higher risk of workflow disruptions. Hence, we strongly recommend backing up your workflow or opting for Jira automation as a safer alternative.
Here are the steps you need to follow if you choose Jira automation: Navigate to your project’s left-hand menu, go to Project settings → Automation → Create Rule.
| Rule | Trigger | Component | Notes |
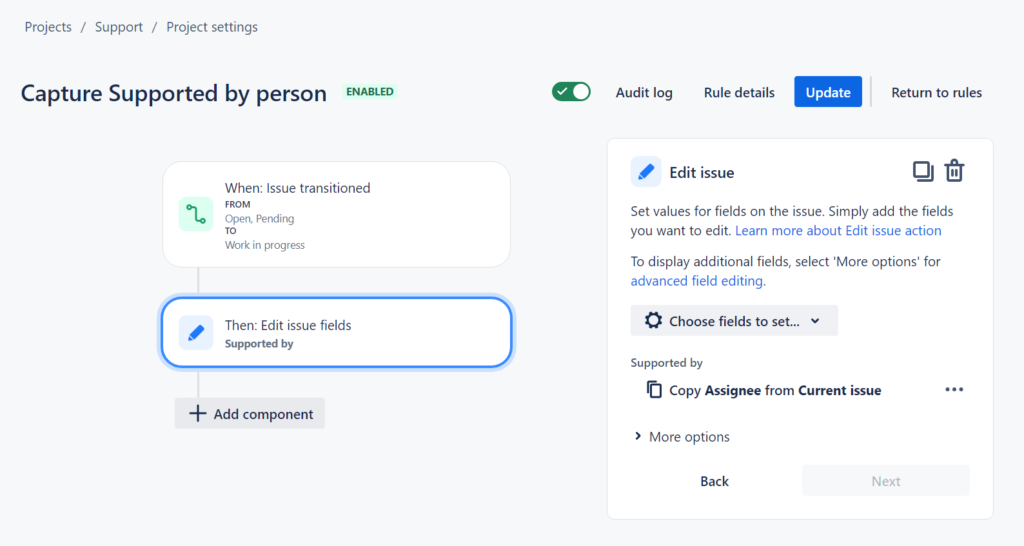
| Capture the Supported by Person | Issue transitioned | Edit issue Field → Select field “Supported by” → Click the … and select “COPY” →” Issue to copy value from” – Current issue , “Field to copy value from” – Assignee | This rule will capture the current assignee and store it in the Supported by field. | Issue transitioned | Issue transitioned | Edit issue Field → Select field “Support Started” → Set value {{now}} |
The function “{{now}}” will set the current time in the following format: 2023-06-20T02:40:37.0+0000. If another date and time format is needed, please consult the following: Jira smart values – date and time | Cloud automation Cloud | Atlassian Support |
| Number of Due Date Changes | Field value changed | Edit issue Field → Select field “Number of Due date changes” → Set value {{#increment}}{{issue.Number of Due date changes}}{{/}} | Your field will be increased by “1” every time the rule is triggered. |
Please be aware that these settings are for demonstration purposes, allowing for the visualization of the process. When implementing your rules, choose transitions that are relevant to your workflows.
At the end your rules should look like this:
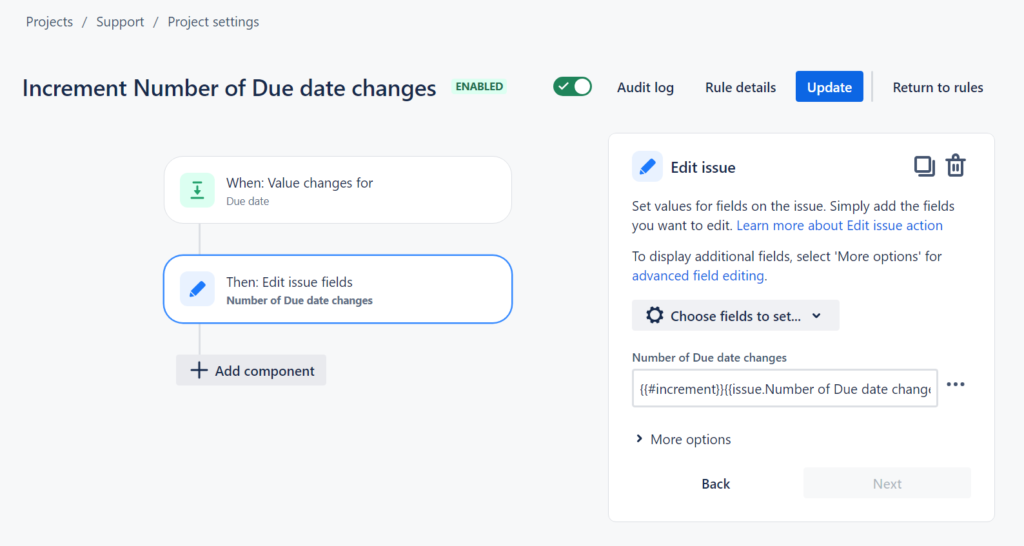
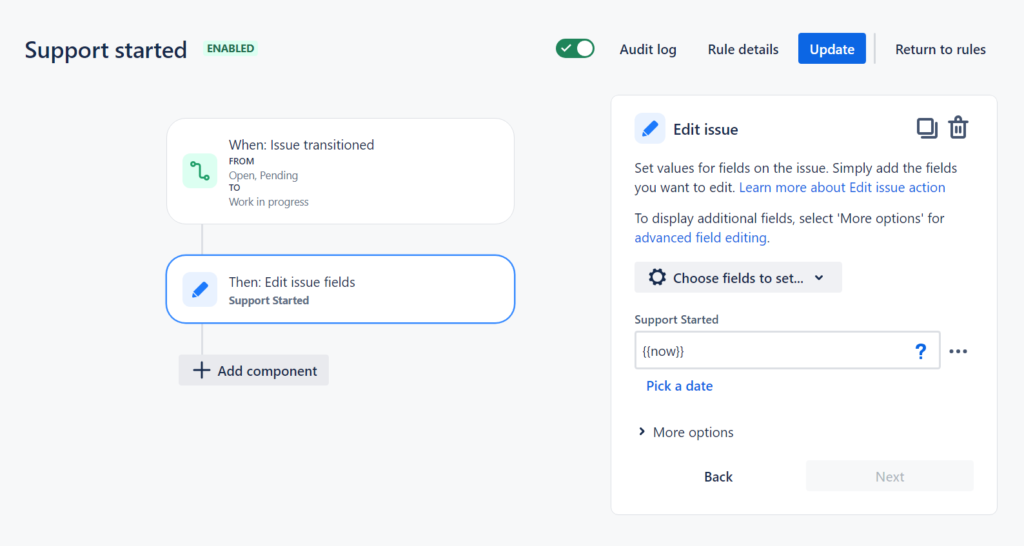
Here’s a step by step video of the process:
Here are the steps you need to follow if you choose Workflow Post Functions: Navigate to your project’s left-hand menu → Workflows. Select the workflow(s) to which you wish to apply this functionality. In our example, we edited the “Start progress,” but you can choose any transition you prefer. Add a Post Function → “Update Issue Custom Field” → click “Add.” In the “Post Function” section, add the following rules:
| Rule | Issue Custom Field | Custom Field Value |
| Supported by | Supported by | %%CURRENT_USER%% |
| Support Started | Support Started | %%CURRENT_DATETIME%% |
| Number of Due Date Changes | *Can be done only with Automation | |
Whether you opt to achieve the desired outcome through Workflow Post Functions or Jira Automation, the end result should be identical.
Getting close to your Jira automation limits.? Check out our 7 Ways To Stay Below Your Jira Automation Usage Limits article.
Step 3: Building Jira Reports with the Performance Objectives App
Follow the three straightforward steps detailed in the article to create new custom fields and gather Jira data using automation or workflow post functions. This will enable you to build customized Jira reports, leveraging native Jira reports and gadgets or utilizing the various charting and reporting tools available on the Marketplace. You can also export this data to spreadsheets and other external tools for further analysis.
Below are examples featuring the Performance Objectives app utilizing the sample custom fields demonstrated in the article.
However, leveraging automation and custom fields ensures the collection of data from the day of their creation. Acquiring historical data may necessitate script writing and can occasionally pose risks to the integrity of the associated workflow.
In contrast, Performance Objectives for Jira stands out as a robust tool that supports a diverse range of charting and reporting features, dynamic and custom fields, metrics, target calculations, and more. The app goes beyond the demo fields presented in this article – such as Test Iterations, Tested by, and Support started – capturing a wealth of historical Jira data. Importantly, all this information can be displayed within the app without the need to create custom fields, as illustrated in the examples below:
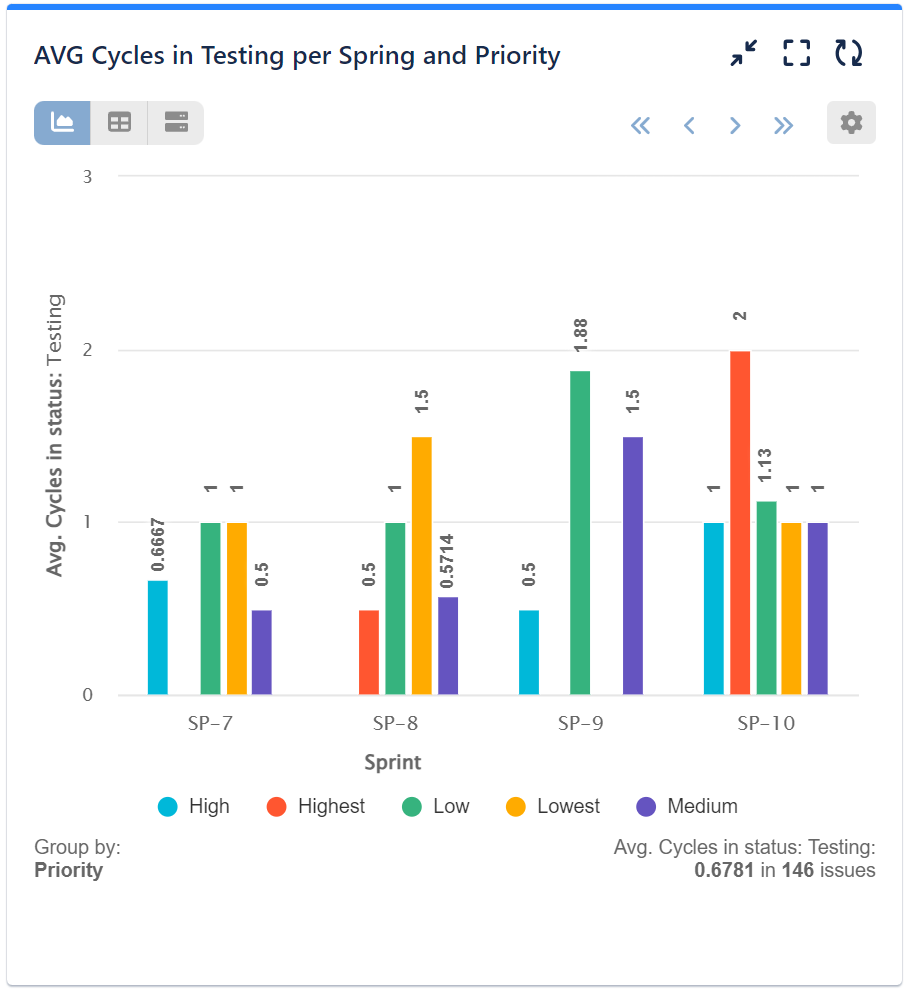
You can effortlessly monitor your test iterations using our metric “Cycles in Status” by choosing the “Testing” status. Opt for “Display by” Sprint to gain a better understanding of your performance across different sprints and identify trends and patterns in the testing process.
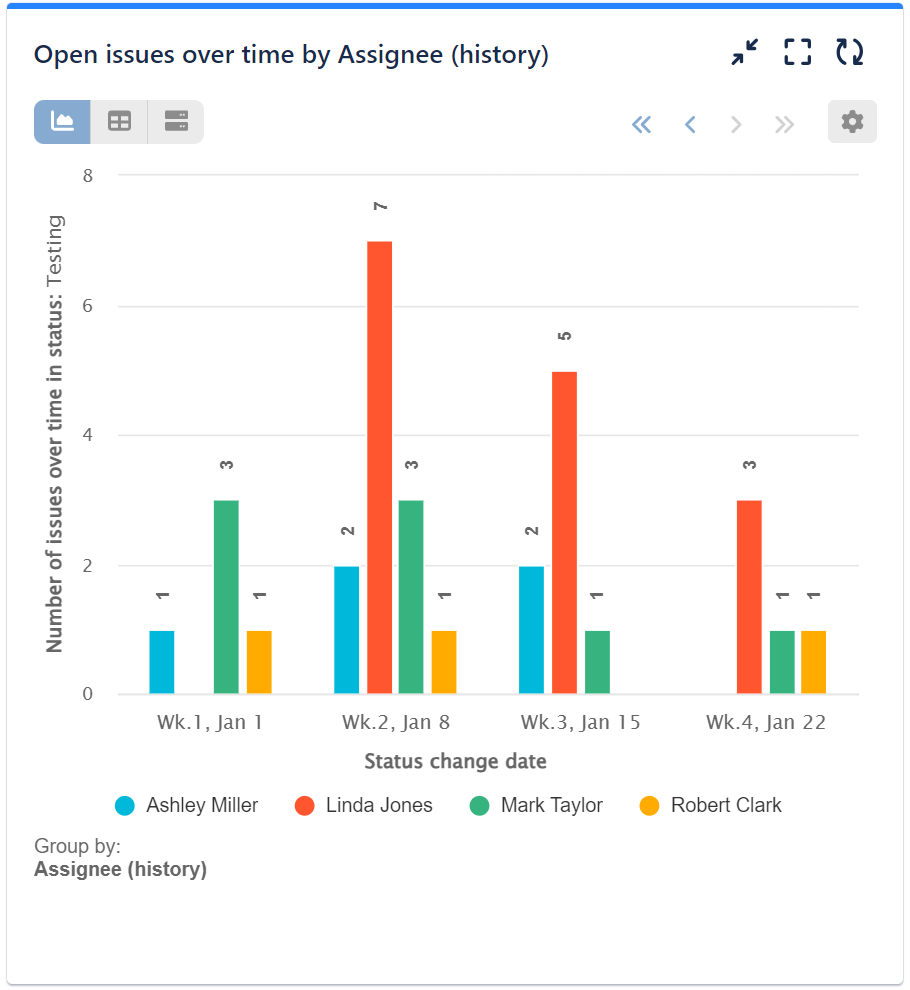
Another readily available metric in the Performance Objectives app is the “Number of issues over time in status”. In this sample chart, we see the open issues in the “Testing” status, displaying the x-axis by Status Change Date and grouping the bars by Assignee (history). This allows you to identify team members who are frequently tasked with testing, providing insights into workload distribution and helping with resource allocation.
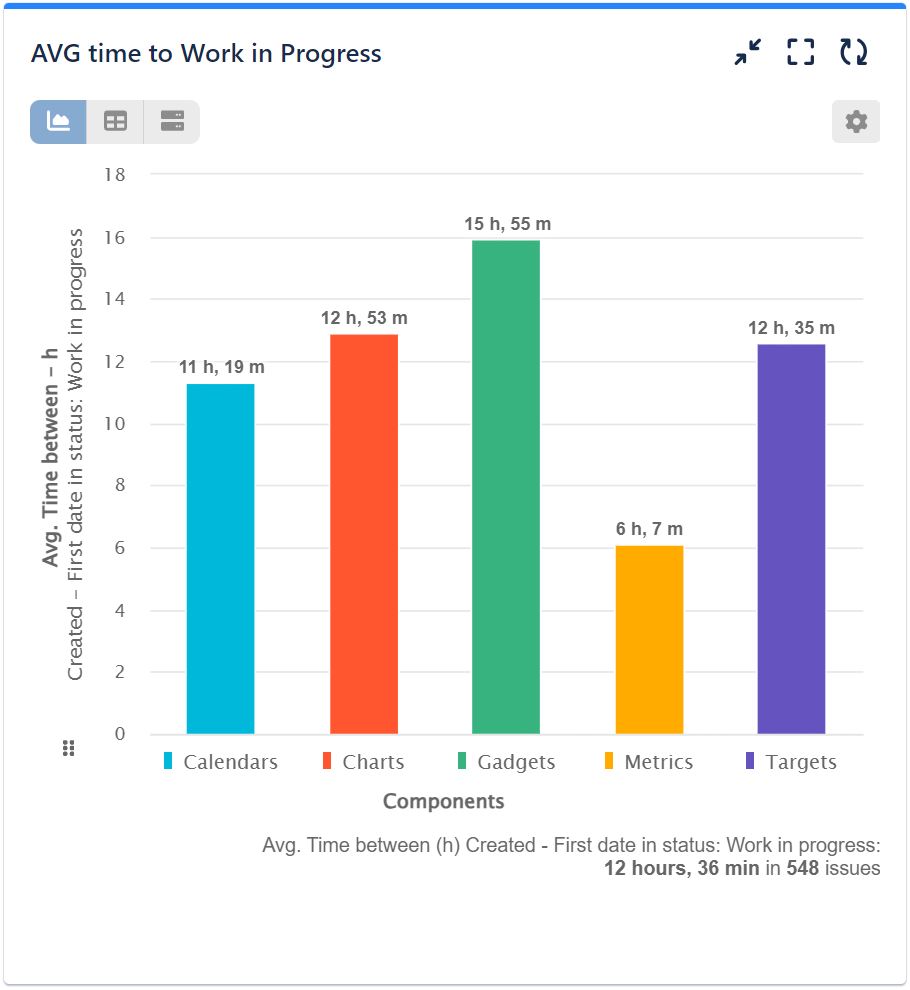
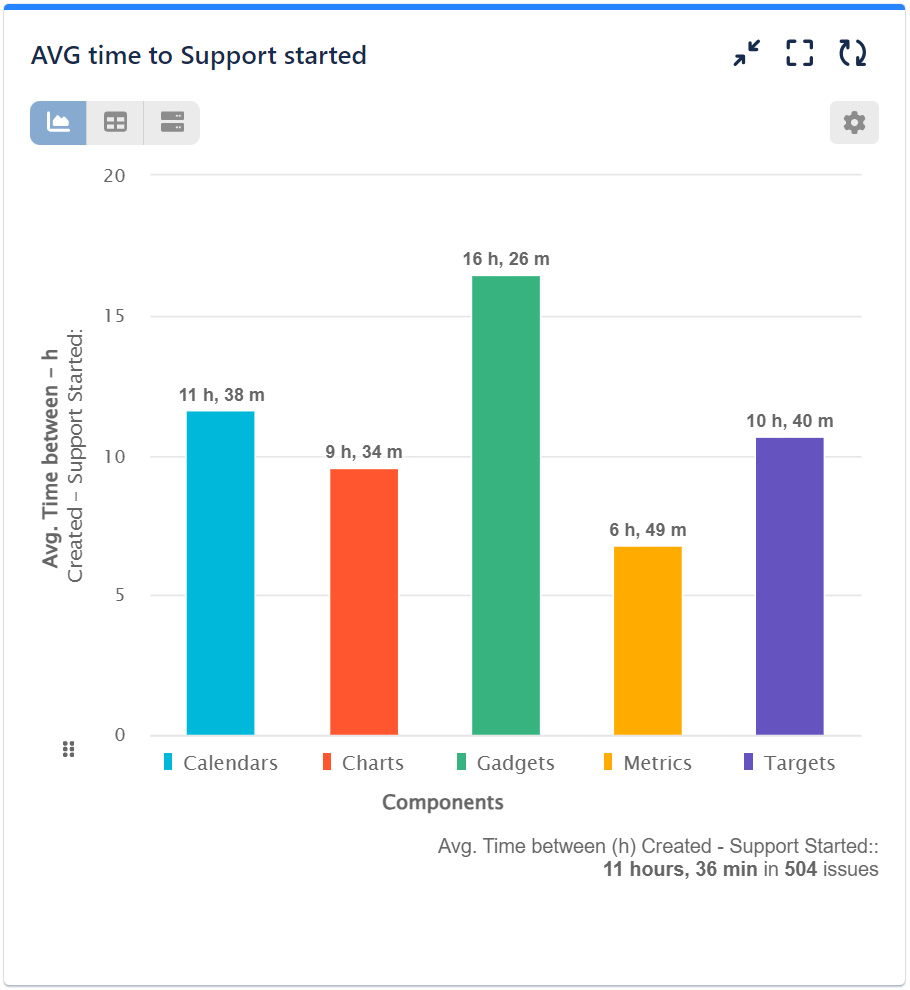
Another valuable and readily available dynamic metric in the app is “Time Between,” allowing you to monitor the duration it takes for issues between events. In our example, we’re measuring the average time from creation to work in progress. We’ve opted for “Components” in the “Display by” option to enrich data insights.
In addition, our app supports the ‘SLA Custom Field Type’ enabling you to report on all your custom SLAs:
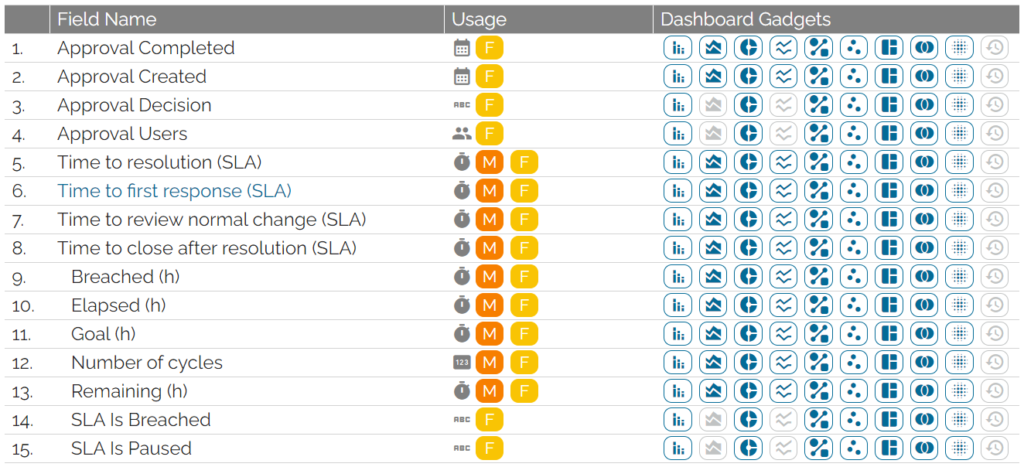
Most importantly, with this app, you can analyze historical Jira data effortlessly and begin gaining insights for past periods for a variety of Fields and Metrics as soon as the app is installed.
Start your 30 days free trial of Performance Objectives: Charts for Jira from Atlassian Marketplace.
