Skip to content

Performance Objectives: Charts for Jira

Powerful reporting app for Jira dashboards
  • Home
  • KPI Examples
  • User Guide
  • Blog
  • YouTube

Docs

Pagination

August 16, 2023 KPI Advisor
Pagination 1

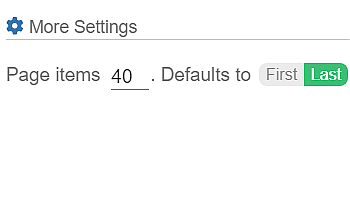
Performance Objectives: Charts for Jira introduces a robust feature allowing chart pagination, granting Jira users the capability to explore detailed…

Continue Reading →

Posted in: Customization, Data Grouping, Data Segmentation Filed under: All, Data Analysis, Styling

Target Results

August 15, 2023 KPI Advisor
target results2

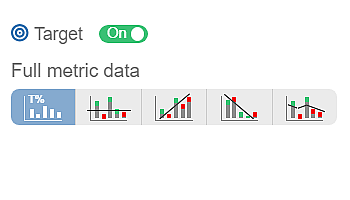
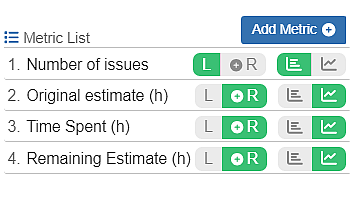
Our Performance Objectives and Performance Trend gadgets come equipped with a dynamic target-setting feature, offering you a multitude of target…

Continue Reading →

Posted in: Targets Filed under: All, Goals

Target Types

KPI Advisor
target types 5

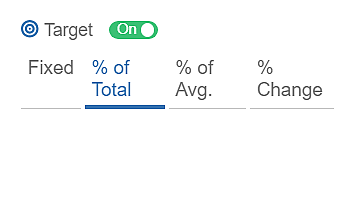
Building Jira KPIs: Four Target Types with the Performance Objectives App Are you tired of relying on external tools, such…

Continue Reading →

Posted in: Targets Filed under: All, Goals

Formula Metrics

KPI Advisor
FormulaMetrics

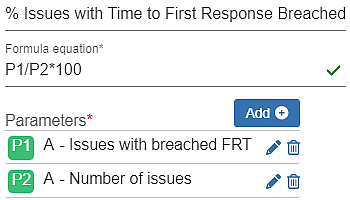
One of the features that set the Performance Objectives app for Jira apart from other charting and reporting tools on…

Continue Reading →

Posted in: Metrics Filed under: All, Metrics

Custom Colors

KPI Advisor
ColorChange3

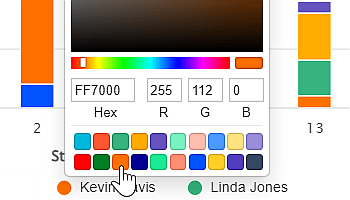
Performance Objectives: Charts for Jira provides a multitude of customization possibilities, including the ability to pick custom colors directly from…

Continue Reading →

Posted in: Customization Filed under: All, Styling

Multiple Metrics

KPI Advisor
MultiMetrics

The Vital Role of Tracking Cycle Time vs Lead Time in Jira Lead time and cycle time are key project…

Continue Reading →

Posted in: Data Grouping, Metrics Filed under: All, Data Analysis, Metrics

Default Table and Pivot Table View

KPI Advisor
Default Pivot

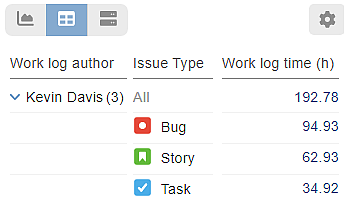
Tables and charts are both valuable tools for presenting data effectively. Each has its own advantages and functions. When deciding…

Continue Reading →

Posted in: Data Grouping, Metrics Filed under: All, Data Analysis

Cumulative Mode

KPI Advisor
CumulativeMode 3

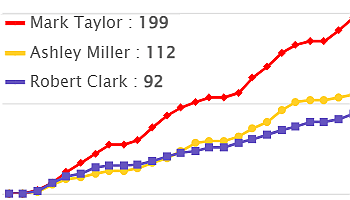
Performance Objectives: Charts for Jira supports cumulative mode configuration option that allows for the accumulation or aggregation of data over time or across different categories.

Continue Reading →

Posted in: Data Grouping Filed under: All, Data Analysis, Metrics

Exclude items with Zero metric values

KPI Advisor

You need to exclude empty dates from your chart in Jira? Performance Objectives: Charts for Jira offers diverse chart result…

Continue Reading →

Posted in: Data Grouping Filed under: All, Data Analysis

By Date Index

KPI Advisor

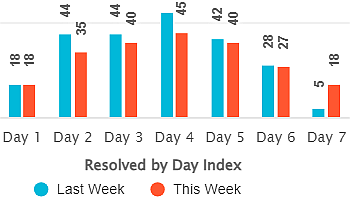
Enhance Period over period analysis – Visualize Jira data using “by date index” in Performance Objectives & Trend gadgets.

Continue Reading →

Posted in: Data Segmentation Filed under: Data Analysis

Post navigation

Page 8 of 13
← Previous 1 … 7 8 9 … 13 Next →
  • Privacy
  • Support
  • Marketplace
  • SLA
  • EULA
  • Security
  • Status
COOKIE AND PRIVACY POLICY
Copyright © 2024 DevAcrobats Ltd. All rights reserved.