Take a closer look at each of the available gadgets in the Performance Objectives: Charts for Jira app and explore the best ways to use them.
Performance Objectives: Charts for Jira app provides a wide range of chart types through its gadgets, allowing you to effectively…
Configuration overview of the app’s robust features and a comprehensive list of Standard and Custom metrics and fields supported by the app, enabling powerful Jira reporting.
Performance Objectives is the flagship gadgets of the app, allowing you to leverage its powerful capabilities to create impressive and insightful bar charts.
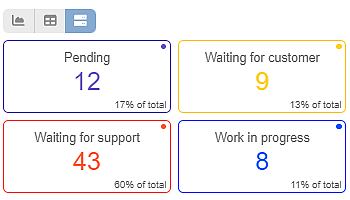
Diverse Jira Dashboards with Seamless Integration of Charts, Tables, and Tiles With our app, Jira users can elevate their user…
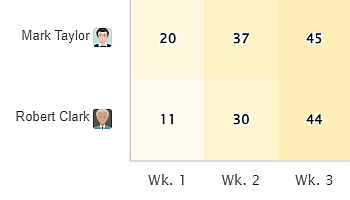
The Heat Map is one of the 10 standalone gadgets available within our app, Performance Objectives for Jira. Discover the…
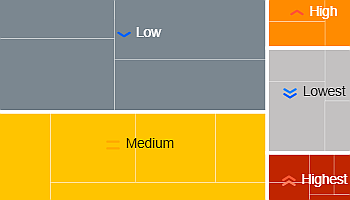
Performance Objectives for the Jira app comes with a variety of 10 dashboard gadgets to suit the reporting needs of…
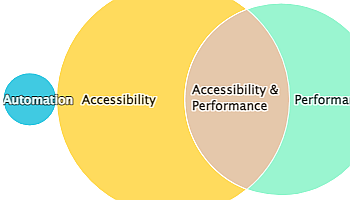
The Venn diagram is one of the 12 chart types supported by the Performance Objectives app for Jira. It’s a…
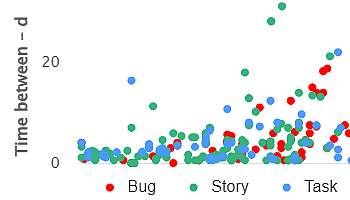
Powerful Data Insights: Harness the Potential of Scatter Charts The Scatter chart, also known as a scatter plot, is a…
The Bubble chart is among the 12 available chart types within our app, enabling you to visualize tasks using up…
Unveiling the Watermelon Effect: What It Is, Why It Happens, and How to Address It Have you heard of the…
Kanban is all about transparency and workflow efficiency. For teams using Kanban in Jira, configuring the right reports and gaining…
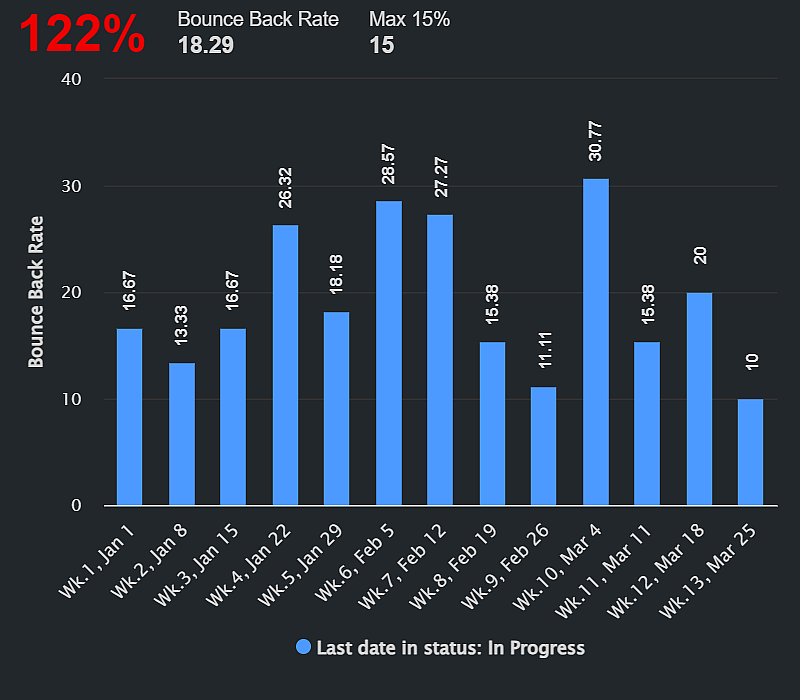
Explore bounce back issues in Jira using the Two-Dimensional Filter Statistics gadget, or gain deeper insights with the Performance Objectives app.
Bounce Back Rate: Why It Matters In agile project management, the Bounce Back Rate is a vital key performance indicator…
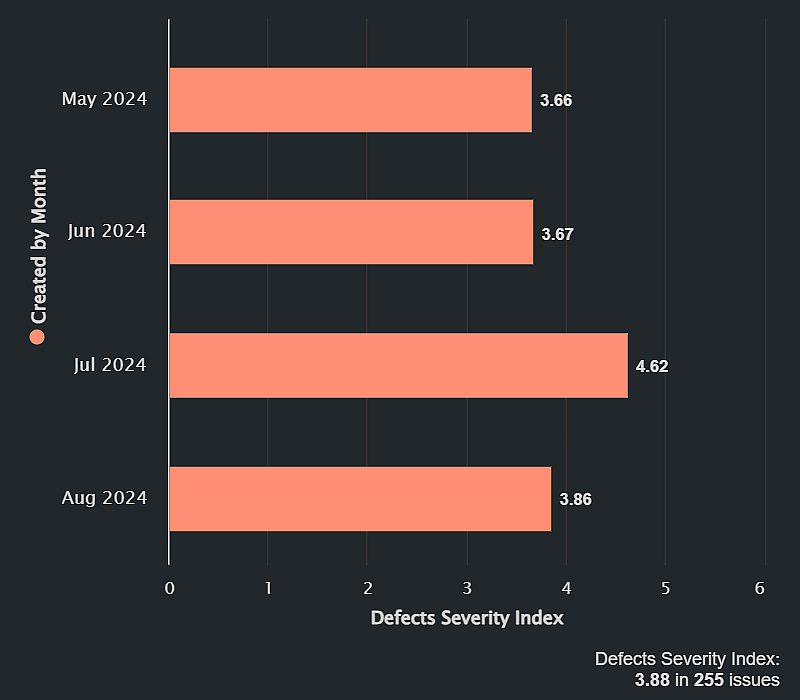
Defects Severity Index: A Key QA Metric in Software Testing In today’s fast-paced software development environment, effective testing is crucial…
Elevate Your Service Management Project Reporting with XLA Reports in JSM In today’s fast-paced business environment, maintaining high standards in…
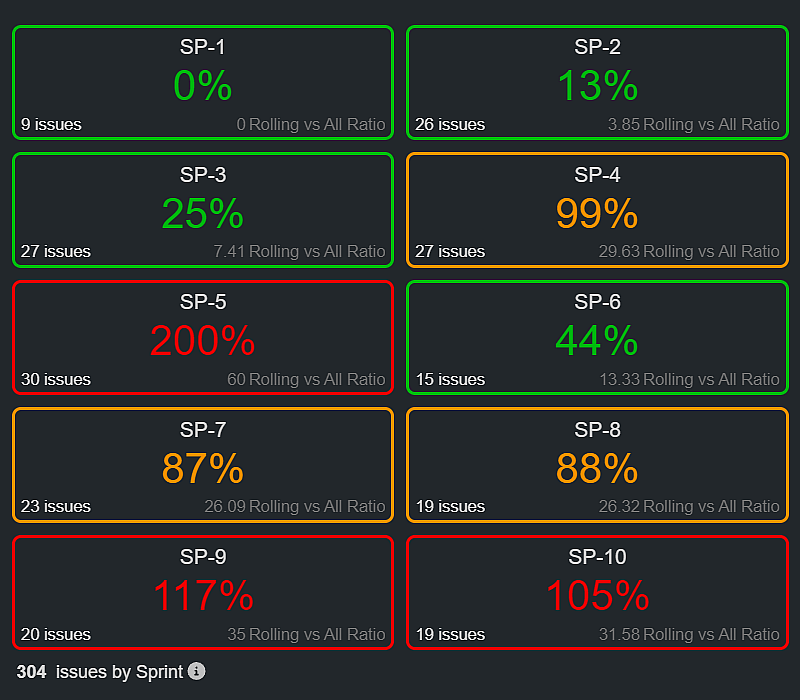
Why Tracking the Sprint Rollover Ratio? In Agile project management, keeping track of sprint efficiency is vital for continuous improvement.…
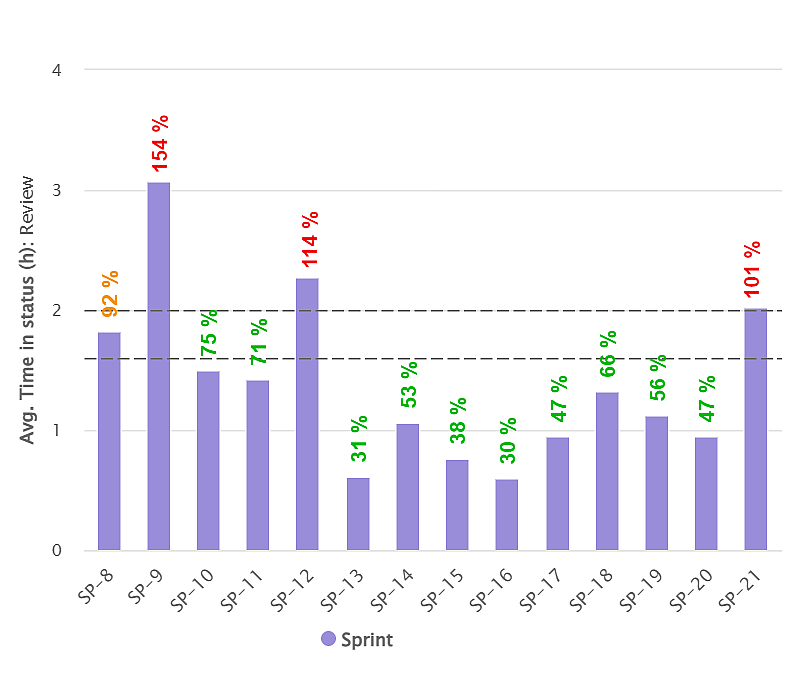
Optimizing Sprint Performance with Average ‘Time in Status’ Metric in Jira In the dynamic world of Agile project management, tracking…
Enable Root Cause Field in Jira In this article, we’ll guide you through the process of setting up a custom…
Simplify Dashboard Management with Saved Filters With the Performance Objectives app, you can effortlessly copy and duplicate the app’s chart…
