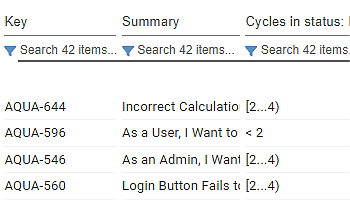
Maximizing Insights with the Issue List View in Scatter & Bubble Gadget The Performance Objectives app for Jira presents a…
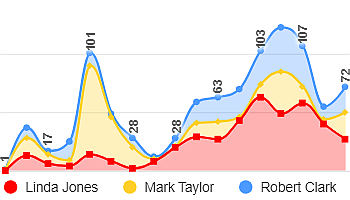
Use Performance Objectives gadgets to create Stacked Area or Stacked Bar charts. Compare data sets within one chart, analyze relationships, and assess relative proportions across categories or dimensions.
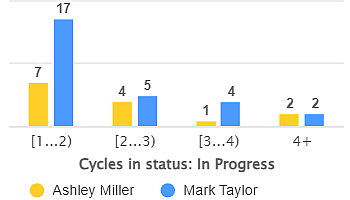
Use ‘Group by’ in Performance Objectives app to break down data by a second dimension, that can be any Jira field, metric, or custom segment.
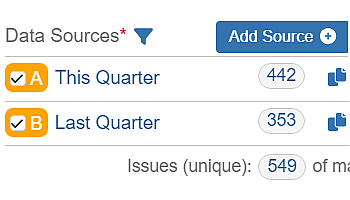
Use Multiple Data Sources for Enhanced Data Segmentation Performance Objectives: Charts for Jira app offers powerful capabilities to segment your…
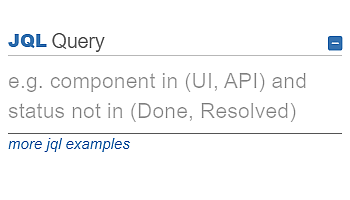
JQL Data segmentation option in Performance Objectives for Jira app provides you the ability to segment relevant data and customize…
Simplify Data Interpretation with Pie Charts in Performance Objectives App Pie charts enjoy widespread popularity due to their simplicity. They…
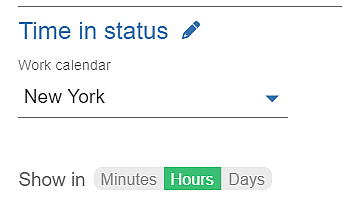
Discover the Power of ‘Time in Status’ Metric Unlock the full potential of your Jira workflow with the ‘Time in…
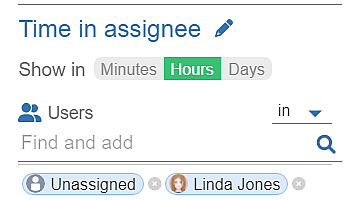
You want to know how long it takes an assignee to complete a task in Jira? Leverage the ‘Time in…
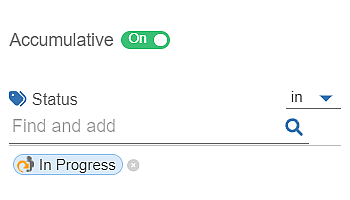
The Accumulative toggle is an option enabled after you select either the ‘Time in Status’ or ‘Time with Assignee’ metric…
Performance Objectives: Charts for Jira provides an array of built-in chart customization options. What distinguishes it is its ability to…
