Tables and charts are both valuable tools for presenting data effectively. Each has its own advantages and functions. When deciding…
Tables and charts are both valuable tools for presenting data effectively. Each has its own advantages and functions. When deciding…
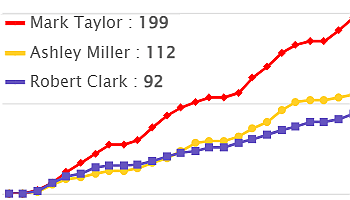
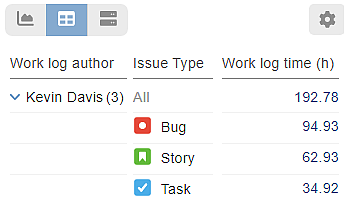
Performance Objectives: Charts for Jira supports cumulative mode configuration option that allows for the accumulation or aggregation of data over time or across different categories.
You need to exclude empty dates from your chart in Jira? Performance Objectives: Charts for Jira offers diverse chart result…
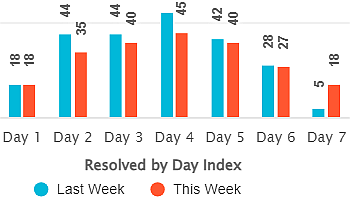
Enhance Period over period analysis – Visualize Jira data using “by date index” in Performance Objectives & Trend gadgets.
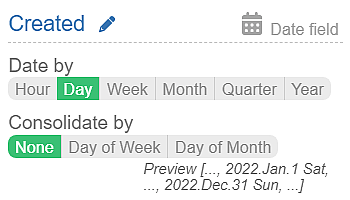
Enhancing Precision with Date-Type Fields and Date Granularity Options in Jira Performance Objectives: Charts for Jira provides support for five…
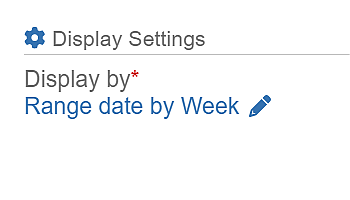
Range Date Field as a Key to Time-Based Data Insights The Range Date is a key Date field, seamlessly integrated…
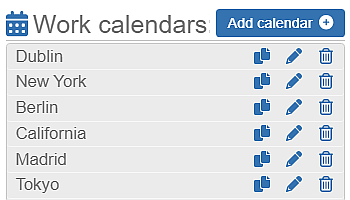
Get actual Time in status, Time in assignee, Time since, and Time between metrics considering the work time. Configure multiple…
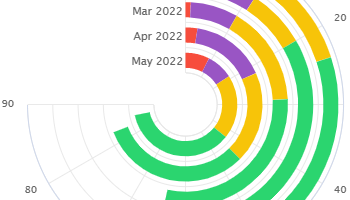
Create Radial Bar Charts on your Jira dashboard by utilizing the ‘Circular Chart’ gadget within the Performance Objectives app. This…
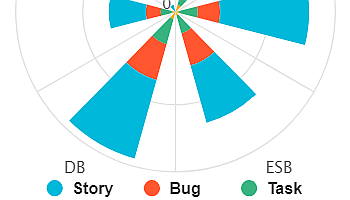
Wind rose chart: Visualize direction and magnitude. Rich display options in Jira for valuable insights and enhanced reporting.
Utilizing Metric Distribution in Performance Objectives Metric Distribution offers a valuable solution when Jira standard charting and tracking tools fail…