Skip to content

Performance Objectives: Charts for Jira

Powerful reporting app for Jira dashboards
  • Home
  • KPI Examples
  • User Guide
  • Blog
  • YouTube

Docs

Rolling Issues vs all KPI

November 29, 2023 KPI Advisor
Thumb rolling vs All issues in Sprint

Managing Sprint Rollover: New Filtering Options with the Performance Objectives App The Performance Objectives app revolutionizes how Jira users create…

Continue Reading →

Posted in: KPI Reports Filed under: All KPIs

First Contact Resolution

November 26, 2023 KPI Advisor
FCR Issues thumb

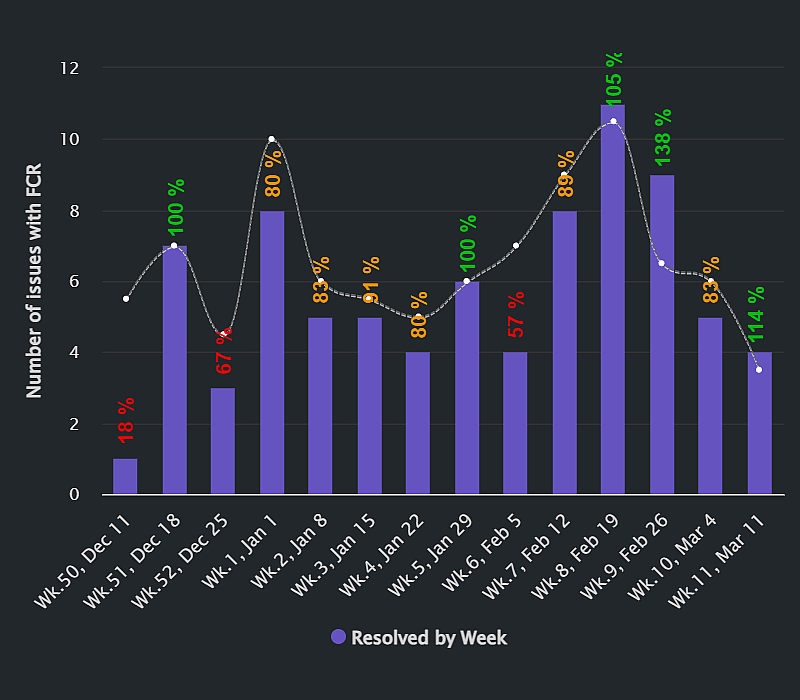
Create report and set target for % of requests resolved on first interaction.

Continue Reading →

Posted in: KPI Reports Filed under: All KPIs, Operations KPIs

Max Issue Age KPI

November 9, 2023 KPI Advisor
Max Issue Age KPI Jira thumb

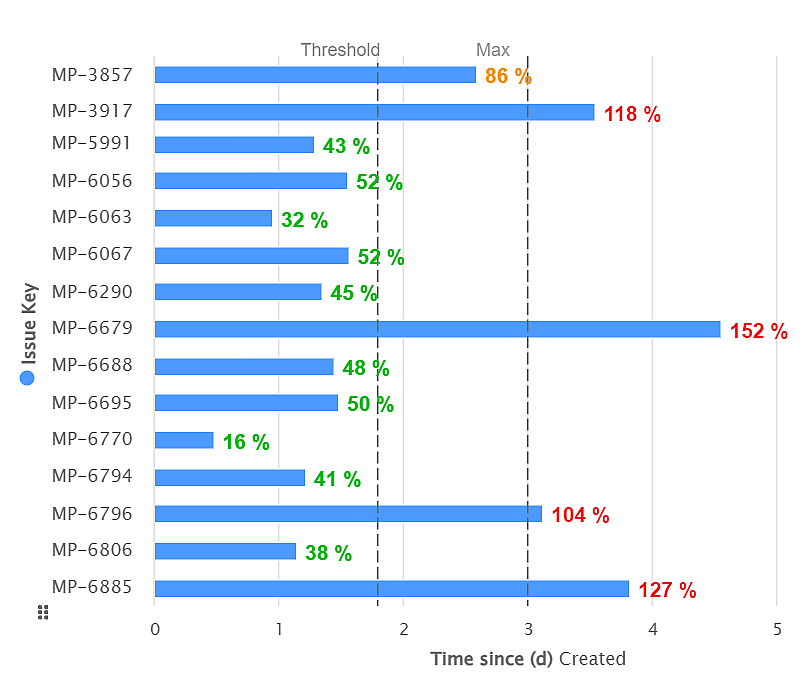
Use ‘Time since’ metric to track time since any standard or custom Jira date field.

Continue Reading →

Posted in: KPI Reports Filed under: All KPIs, Operations KPIs, Project Delivery KPIs

% of High Severity Defects KPI

November 1, 2023 KPI Advisor
Percent of High Severity Defects KPI Thumb dark

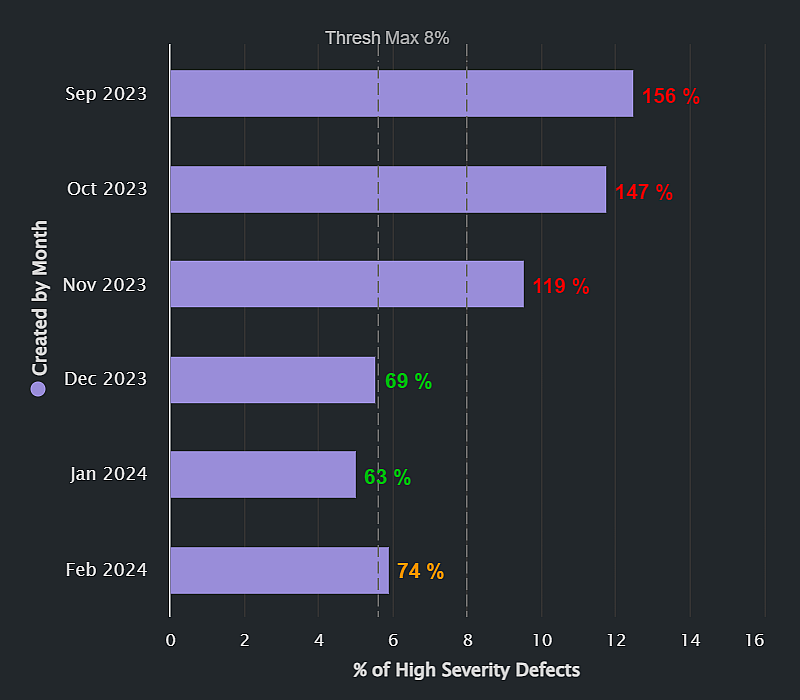
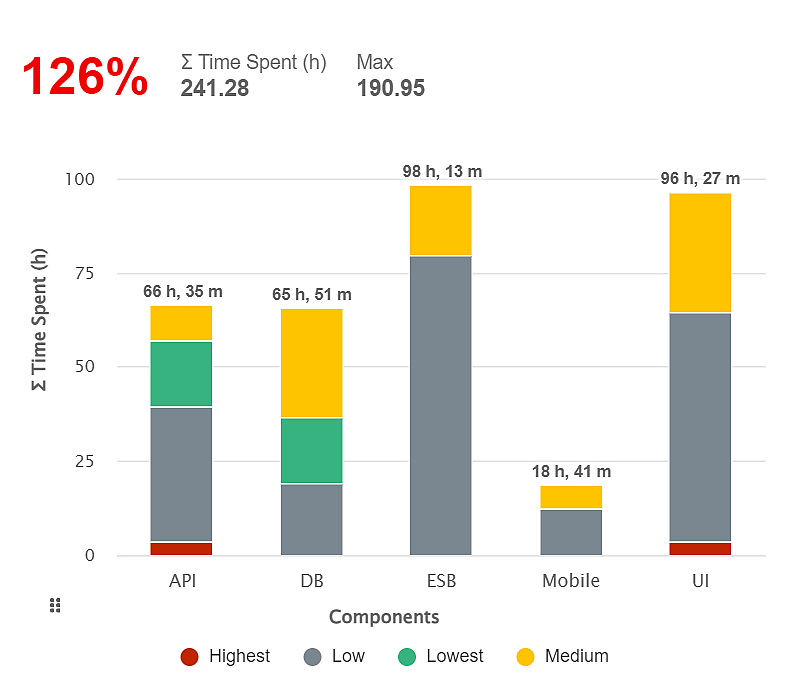
Track the % of High Severity Defects with Performance Objectives in Jira.

Continue Reading →

Posted in: KPI Reports Filed under: All KPIs, Development KPIs, QA KPIs

Time Spent in Rework KPI

October 26, 2023 KPI Advisor
Time Spent In Rework KPI Jira Dashboard Thumb

Use Time in Rework Report for efficiency and improvements with Performance Objectives app.

Continue Reading →

Posted in: KPI Reports Filed under: All KPIs, Development KPIs, Project Delivery KPIs, QA KPIs

Venn Diagram

October 14, 2023 KPI Advisor
VennDiagram

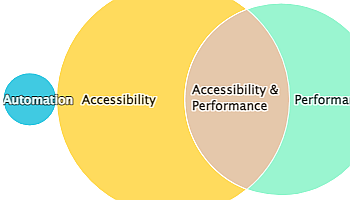
The Venn diagram is one of the 12 chart types supported by the Performance Objectives app for Jira. It’s a…

Continue Reading →

Posted in: Dashboard Gadgets, Data Grouping, Data Segmentation Filed under: All, Data Analysis, Gadgets

Scatter chart

KPI Advisor
ScatterPlot 2

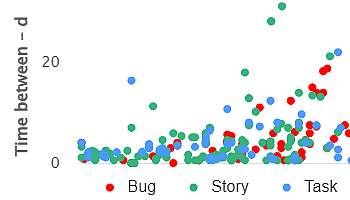
Powerful Data Insights: Harness the Potential of Scatter Charts The Scatter chart, also known as a scatter plot, is a…

Continue Reading →

Posted in: Data Grouping, Data Segmentation, Metrics Filed under: All, Data Analysis, Gadgets, Metrics

Bubble chart

KPI Advisor
BubbleChart 1

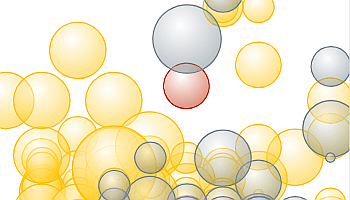
The Bubble chart is among the 12 available chart types within our app, enabling you to visualize tasks using up…

Continue Reading →

Posted in: Data Grouping, Data Segmentation Filed under: All, Data Analysis, Gadgets, Metrics

Issue List View: Scatter & Bubble Charts Gadget

KPI Advisor
Issue list view thumb

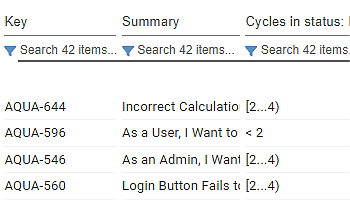
Maximizing Insights with the Issue List View in Scatter & Bubble Gadget The Performance Objectives app for Jira presents a…

Continue Reading →

Posted in: Metrics, Settings Filed under: All, Data Analysis, Metrics

Number of open issues over time

October 13, 2023 KPI Advisor
Open Issues Over Time

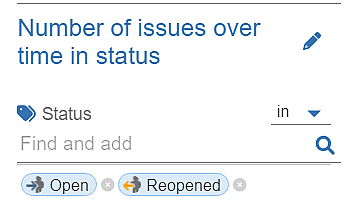
Display open issues over time in Jira Dashboard. Keep your ticketing process under control using ‘Number of Issues over time…

Continue Reading →

Posted in: Metrics Filed under: All, Metrics

Post navigation

Page 5 of 13
← Previous 1 … 4 5 6 … 13 Next →
  • Privacy
  • Support
  • Marketplace
  • SLA
  • EULA
  • Security
  • Status
COOKIE AND PRIVACY POLICY
Copyright © 2024 DevAcrobats Ltd. All rights reserved.