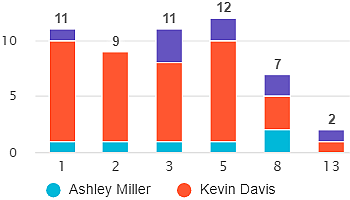
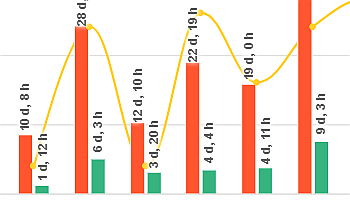
Performance Objectives is the flagship gadgets of the app, allowing you to leverage its powerful capabilities to create impressive and insightful bar charts.
Performance Objectives is the flagship gadgets of the app, allowing you to leverage its powerful capabilities to create impressive and insightful bar charts.
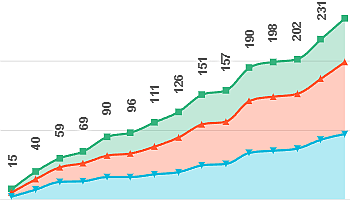
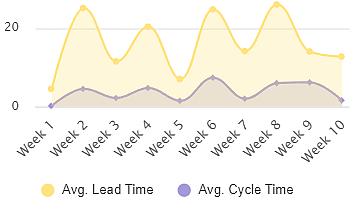
Performance Trend Gadget: Spotting Patterns on Your Jira Dashboard Introducing one of the 10 standalone Jira dashboard gadgets offered within…
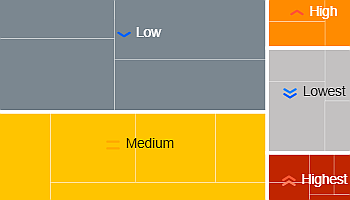
The Heat Map is one of the 10 standalone gadgets available within our app, Performance Objectives for Jira. Discover the…
Performance Objectives for the Jira app comes with a variety of 10 dashboard gadgets to suit the reporting needs of…
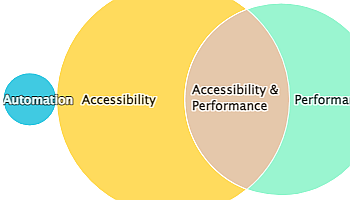
The Venn diagram is one of the 12 chart types supported by the Performance Objectives app for Jira. It’s a…
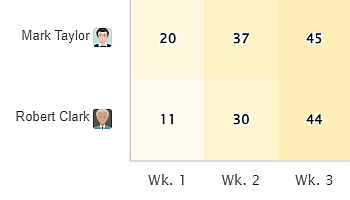
Explore Cross-Metric Analysis with Multi Metric Combined Gadget The Performance Objectives app introduces a suite of 10 Jira dashboard gadgets,…
Explore Cross-Metric Trend Analysis with Multi Metric Trend Gadget The Multi Metric Trend Chart is one of the 10 standalone…
At present, the Jira Cloud Migration Assistant does not support the automatic migration of dashboards with 3rd party gadgets from…
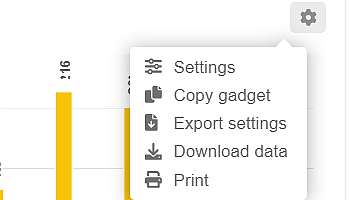
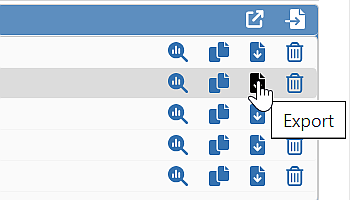
New Feature Launch Seamlessly replicate your Performance Objectives app’s charts on various Jira dashboards by our new feature “copy” gadget…
Monitor field changes and trends in Jira with the Change History Gadget for data-driven insights.