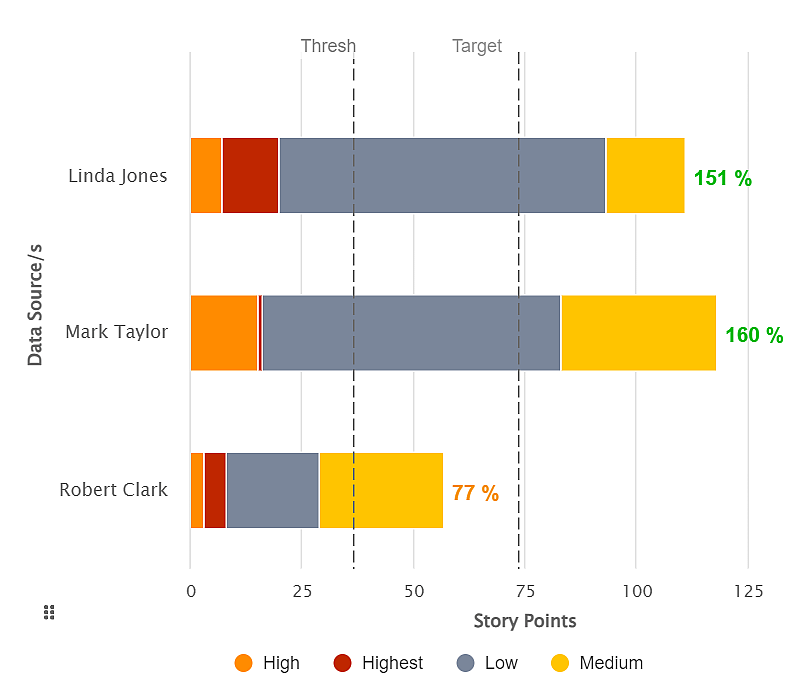
Define personal goals: % of total team Story Points over multiple Sprints.
Introduction In Jira, there isn’t a standard feature specifically designed to recognize story points by developers individually, out-of-the-box. Story points…
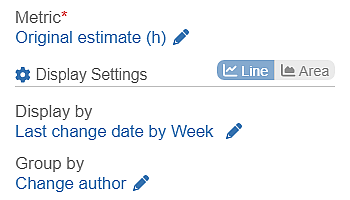
Monitor field changes and trends in Jira with the Change History Gadget for data-driven insights.
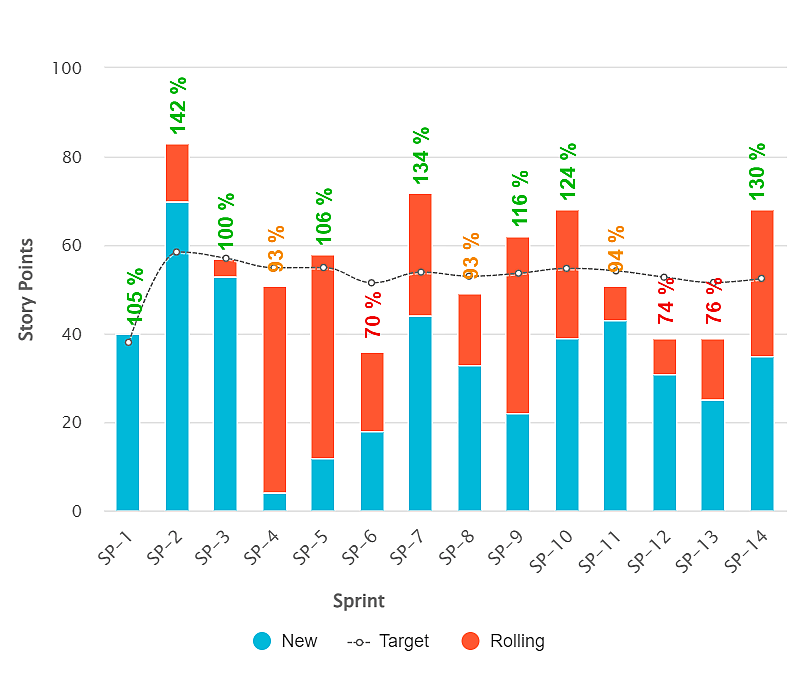
Analyze team velocity in Jira and set Target as a % of Moving Average Story Points.
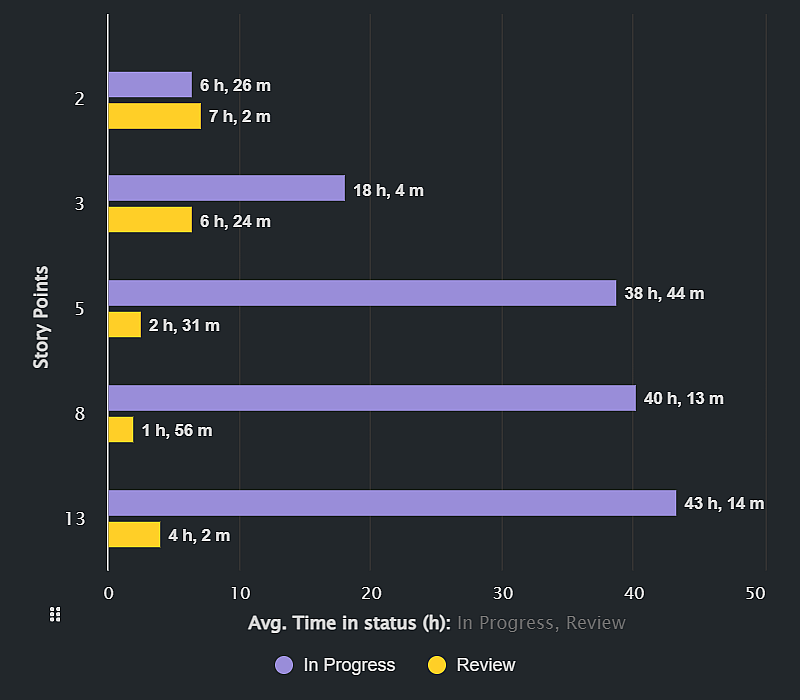
Explore Story points and time estimates for valuable insights with Performance Objectives app.
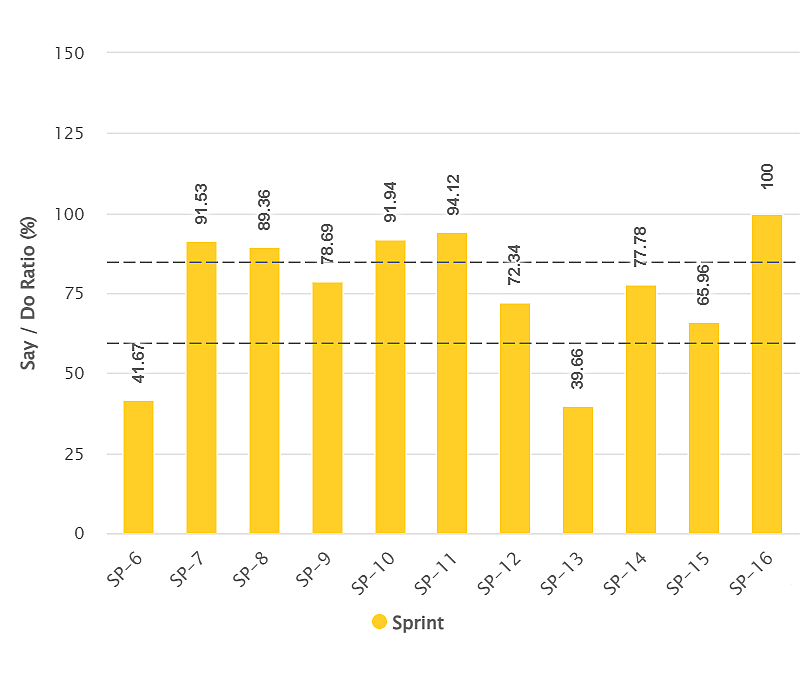
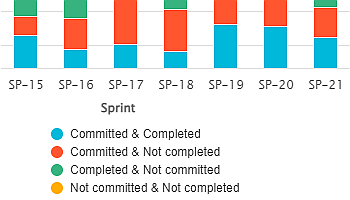
We’re excited to introduce new reporting options that enhance Sprint analysis through our updated filtering features and metrics. This article…
Configuration overview of the app’s robust features and a comprehensive list of Standard and Custom metrics and fields supported by the app, enabling powerful Jira reporting.
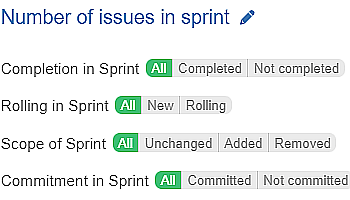
Introducing New Sprint-Related Filtering Options In addition to the wide range of Agile metrics and fields already built into the…
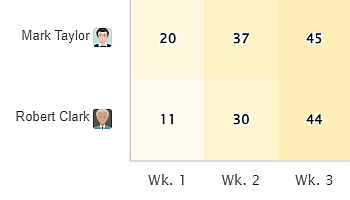
The Heat Map is one of the 10 standalone gadgets available within our app, Performance Objectives for Jira. Discover the…
Using the Performance Objectives app, you can leverage a variety of sprint-related metrics and fields to build comprehensive sprint reports…
