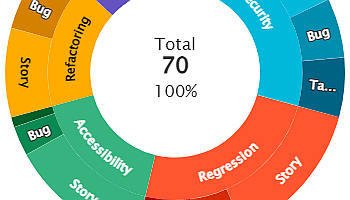
Create impressive interactive reports with Sunburst chart visualization on your Jira Dashboard using the ‘Circular Chart’ gadget available within the…
Create impressive interactive reports with Sunburst chart visualization on your Jira Dashboard using the ‘Circular Chart’ gadget available within the…
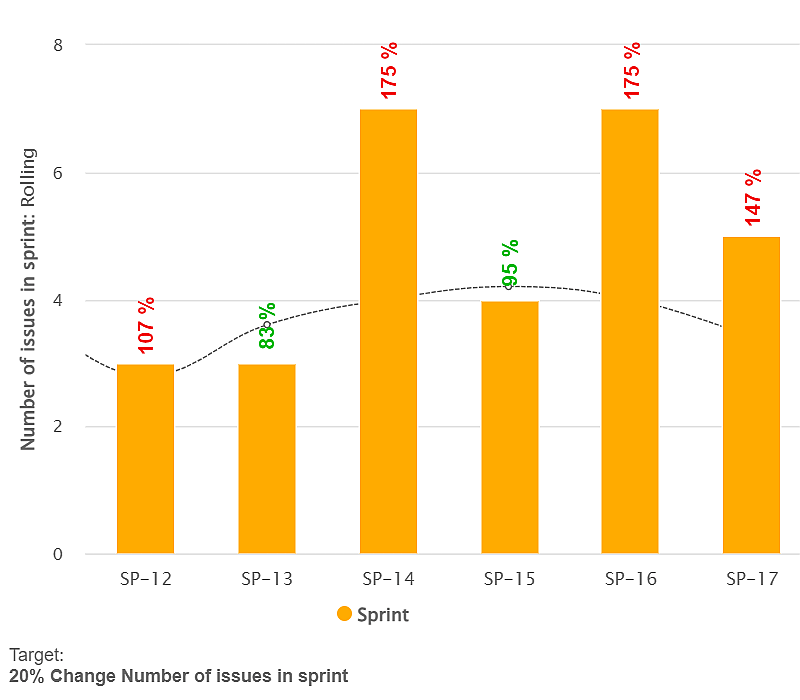
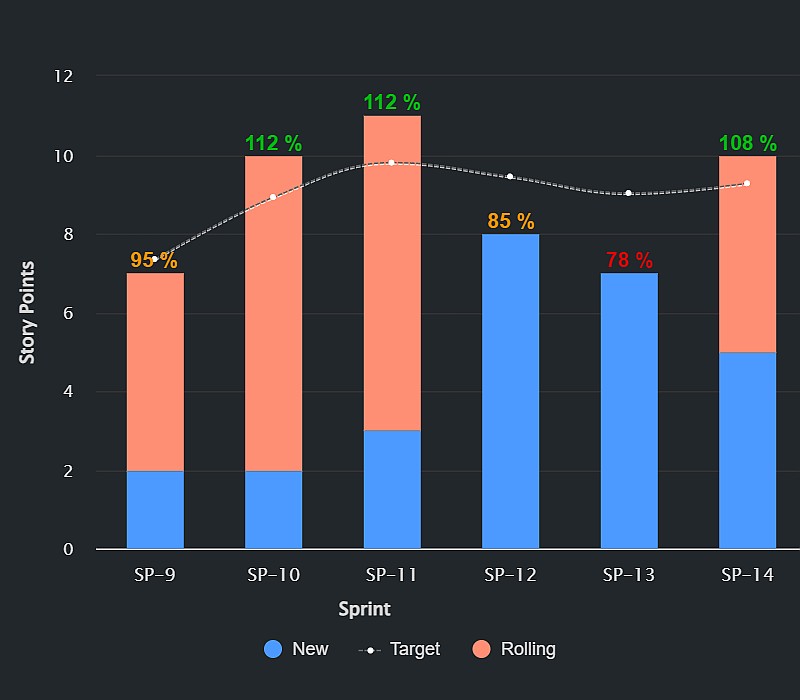
Managing Sprint Rollover: New Filtering Options with the Performance Objectives App The Performance Objectives app revolutionizes how Jira users create…
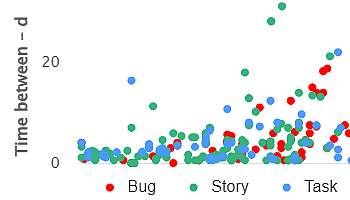
Powerful Data Insights: Harness the Potential of Scatter Charts The Scatter chart, also known as a scatter plot, is a…
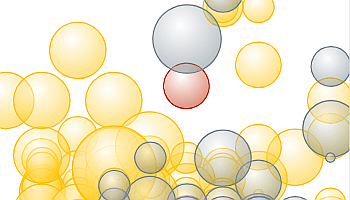
The Bubble chart is among the 12 available chart types within our app, enabling you to visualize tasks using up…
Create Personal Velocity report for insights into individual performance.
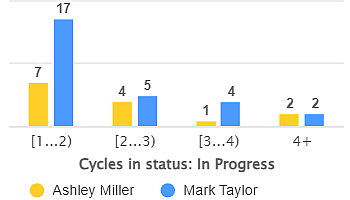
Use ‘Group by’ in Performance Objectives app to break down data by a second dimension, that can be any Jira field, metric, or custom segment.
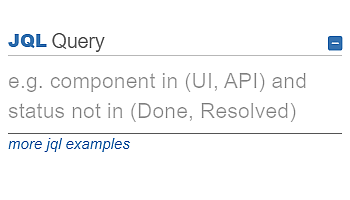
JQL Data segmentation option in Performance Objectives for Jira app provides you the ability to segment relevant data and customize…
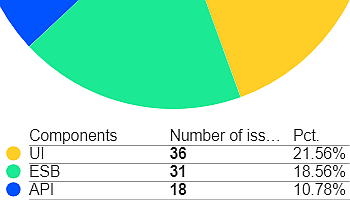
Simplify Data Interpretation with Pie Charts in Performance Objectives App Pie charts enjoy widespread popularity due to their simplicity. They…
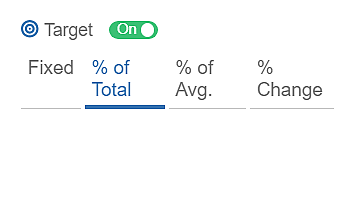
Building Jira KPIs: Four Target Types with the Performance Objectives App Are you tired of relying on external tools, such…
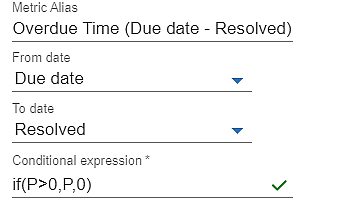
The Conditional Metric is an advanced feature of the Performance Objectives for Jira app, offering enhanced flexibility. It empowers Jira…