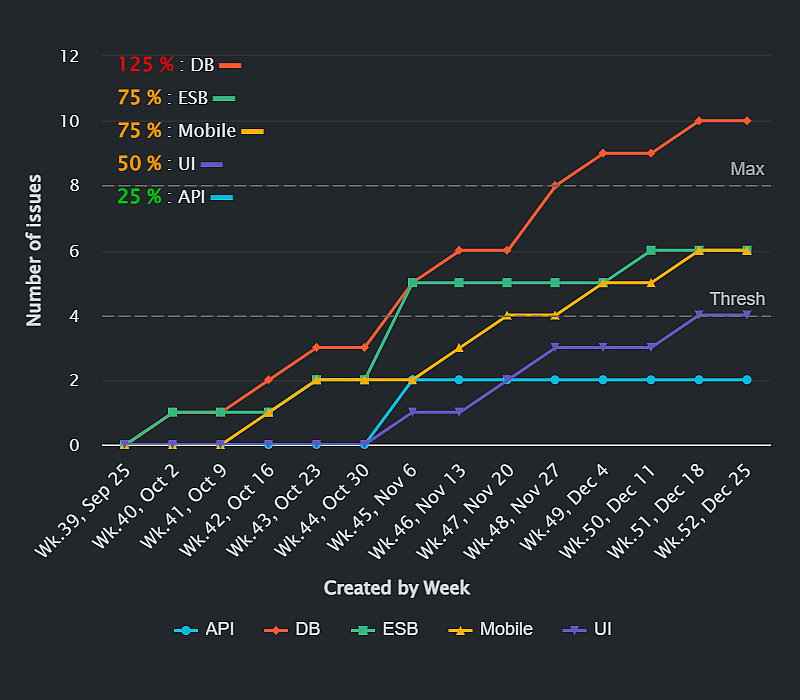
Monitor bugs missed by engineering or number of defects with Performance Objectives app.
Monitor bugs missed by engineering or number of defects with Performance Objectives app.
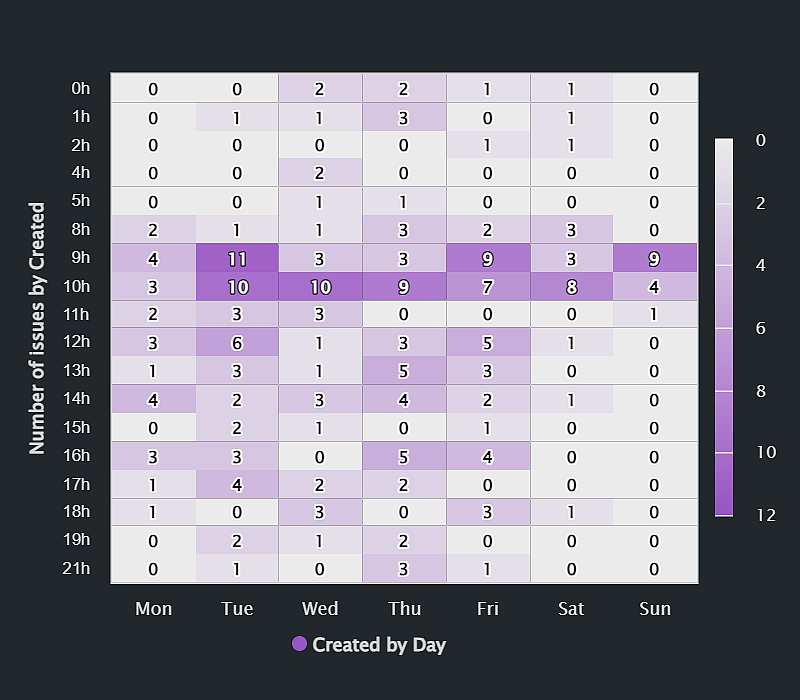
Create comprehensive reports based on timeframes like day, week, or month. Identify busy periods, plan shift coverage, and enhance support operations. Gain valuable insights and make informed decisions in Jira and Jira Service Management (JSM).
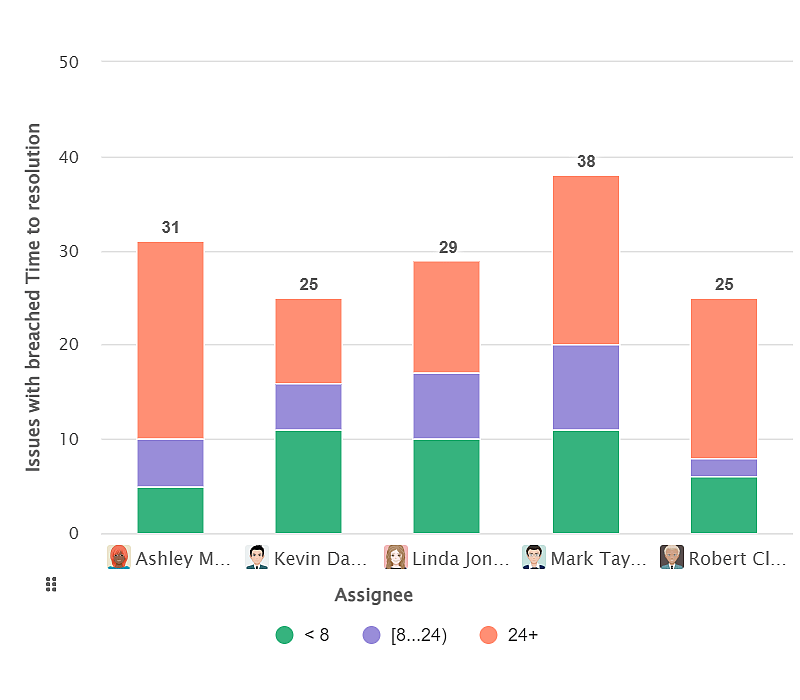
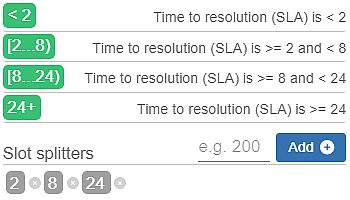
In this guide, we present various configurations to effectively track and visualize SLA breaches on your Jira Service Management dashboard.…
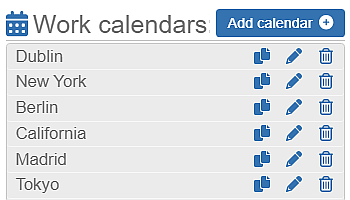
Get actual Time in status, Time in assignee, Time since, and Time between metrics considering the work time. Configure multiple…
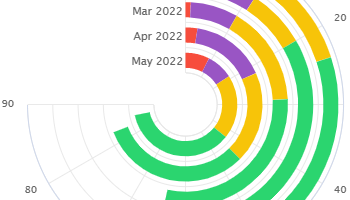
Create Radial Bar Charts on your Jira dashboard by utilizing the ‘Circular Chart’ gadget within the Performance Objectives app. This…

Leverage the ‘Asset Name’ field in Jira reports using custom field and automation.
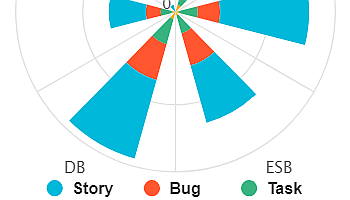
Wind rose chart: Visualize direction and magnitude. Rich display options in Jira for valuable insights and enhanced reporting.
Utilizing Metric Distribution in Performance Objectives Metric Distribution offers a valuable solution when Jira standard charting and tracking tools fail…

Introduction In this blog article, we will explore the significance of Root Cause Analysis (RCA) in managing bugs, defects, and…
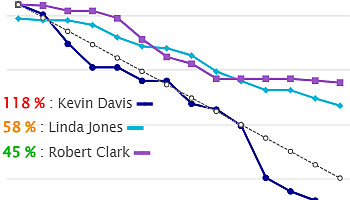
Burndown charts are invaluable in project management and agile software development, offering a host of advantages. In the context of…