Skip to content
Performance Objectives: Charts for Jira
Powerful reporting app for Jira dashboards
  • Home
  • KPI Examples
  • User Guide
  • Blog
  • YouTube

Tag: All

Sprint Scope Change Report

February 27, 2024 KPI Advisor
Sprint Scope Change Thumb

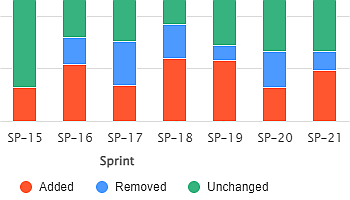
By leveraging the Sprint Scope Change field supported by the Performance Objectives app, agile teams can effectively manage scope creep,…

Continue Reading →

Posted in: Settings Filed under: All

Cycles in Sprint Report

February 23, 2024 KPI Advisor
Cycles in sprint thumb

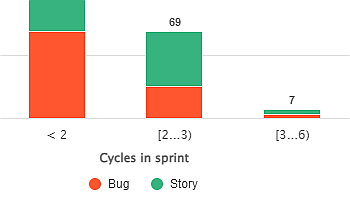
The ‘Cycles in Sprint’ metric, supported by the Performance Objectives app for Jira provides valuable insights into how many times…

Continue Reading →

Posted in: Metrics, Settings Filed under: All

Sunburst Chart / Donut Chart

December 1, 2023 KPI Advisor
Sunburst1

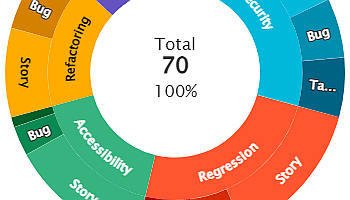
Create impressive interactive reports with Sunburst chart visualization on your Jira Dashboard using the ‘Circular Chart’ gadget available within the…

Continue Reading →

Posted in: Data Grouping Filed under: All, Data Analysis

Tree Map Gadget

KPI Advisor
treemap 2

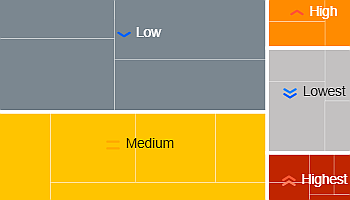
Performance Objectives for the Jira app comes with a variety of 10 dashboard gadgets to suit the reporting needs of…

Continue Reading →

Posted in: Dashboard Gadgets, Data Grouping, Data Segmentation Filed under: All, Data Analysis, Gadgets

Venn Diagram

October 14, 2023 KPI Advisor
VennDiagram

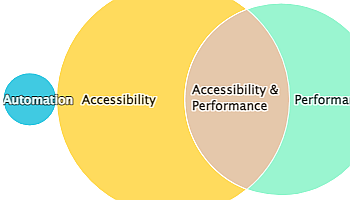
The Venn diagram is one of the 12 chart types supported by the Performance Objectives app for Jira. It’s a…

Continue Reading →

Posted in: Dashboard Gadgets, Data Grouping, Data Segmentation Filed under: All, Data Analysis, Gadgets

Scatter chart

KPI Advisor
ScatterPlot 2

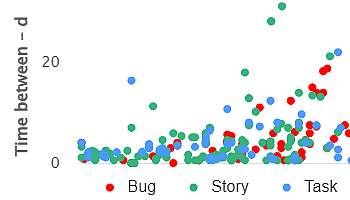
Powerful Data Insights: Harness the Potential of Scatter Charts The Scatter chart, also known as a scatter plot, is a…

Continue Reading →

Posted in: Data Grouping, Data Segmentation, Metrics Filed under: All, Data Analysis, Gadgets, Metrics

Bubble chart

KPI Advisor
BubbleChart 1

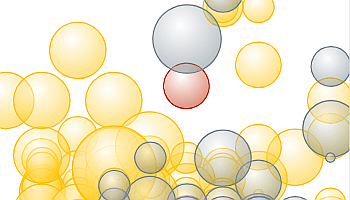
The Bubble chart is among the 12 available chart types within our app, enabling you to visualize tasks using up…

Continue Reading →

Posted in: Data Grouping, Data Segmentation Filed under: All, Data Analysis, Gadgets, Metrics

Issue List View: Scatter & Bubble Charts Gadget

KPI Advisor
Issue list view thumb

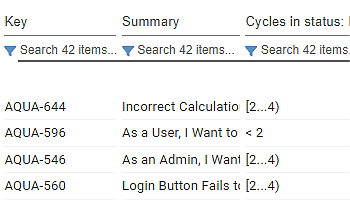
Maximizing Insights with the Issue List View in Scatter & Bubble Gadget The Performance Objectives app for Jira presents a…

Continue Reading →

Posted in: Metrics, Settings Filed under: All, Data Analysis, Metrics

Number of open issues over time

October 13, 2023 KPI Advisor
Open Issues Over Time

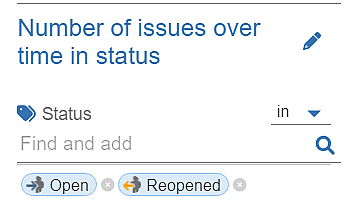
Display open issues over time in Jira Dashboard. Keep your ticketing process under control using ‘Number of Issues over time…

Continue Reading →

Posted in: Metrics Filed under: All, Metrics

Stack by

September 14, 2023 KPI Advisor
StackBy 5

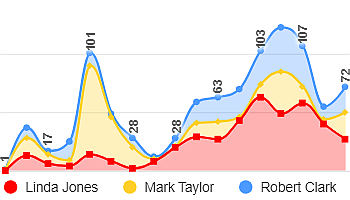
Use Performance Objectives gadgets to create Stacked Area or Stacked Bar charts. Compare data sets within one chart, analyze relationships, and assess relative proportions across categories or dimensions.

Continue Reading →

Posted in: Data Grouping Filed under: All, Data Analysis, Getting started, Metrics

Post navigation

Page 2 of 7
← Previous 1 2 3 … 7 Next →

BY CATEGORY

  • expandBlog
  • expandGetting Started
  • expandKPI Reports
  • expandSettings
    • expandCustomization
    • expandDashboard Gadgets
    • expandData Grouping
    • expandData Segmentation
    • expandMetrics
    • expandTargets

BY TAG

  • expandAll
  • expandAll KPIs
  • expandData Analysis
  • expandDevelopment KPIs
  • expandGadgets
  • expandGetting started
  • expandGoals
  • expandMetrics
  • expandOperations KPIs
  • expandProject Delivery KPIs
  • expandQA KPIs
  • expandStyling
LEGEND
pin
Number
calendar_month
Date
timer
Time
abc
Text
people
User
M
Metric
F
Field
lock_open
Dependent Field
check
Supported
horizontal_rule
Not Supported
stacked_bar_chart
Performance Objectives Gadget
area_chart
Performance Trend Gadget
donut_small
Circular Chart Gadget
ssid_chart
Multi Metric Trend Gadget
shape_line
Multi Metric Combined Gadget
scatter_plot
Scatter & Bubble Chart Gadget
space_dashboard
Tree Map Gadget
join_full
Venn Diagramm Gadget
blur_on
Heat Map Gadget
history
Change History Gadget
  • Privacy
  • Support
  • Marketplace
  • SLA
  • EULA
  • Security
  • Status
COOKIE AND PRIVACY POLICY
Copyright © 2024 DevAcrobats Ltd. All rights reserved.