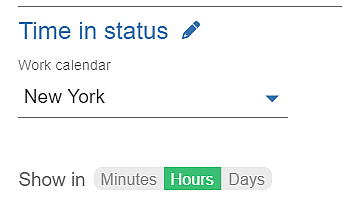
Discover the Power of ‘Time in Status’ Metric Unlock the full potential of your Jira workflow with the ‘Time in…
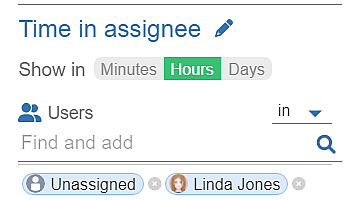
You want to know how long it takes an assignee to complete a task in Jira? Leverage the ‘Time in…
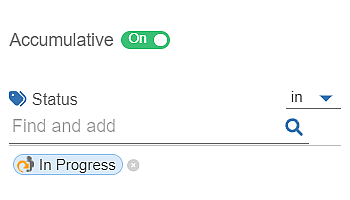
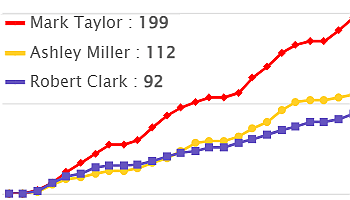
The Accumulative toggle is an option enabled after you select either the ‘Time in Status’ or ‘Time with Assignee’ metric…
Performance Objectives: Charts for Jira provides an array of built-in chart customization options. What distinguishes it is its ability to…
One of the features that set the Performance Objectives app for Jira apart from other charting and reporting tools on…
The Vital Role of Tracking Cycle Time vs Lead Time in Jira Lead time and cycle time are key project…
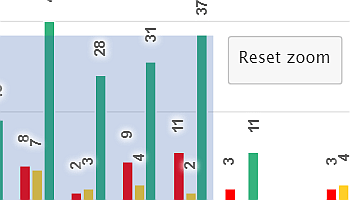
Performance Objectives: Charts for Jira supports cumulative mode configuration option that allows for the accumulation or aggregation of data over time or across different categories.
Get actual Time in status, Time in assignee, Time since, and Time between metrics considering the work time. Configure multiple…
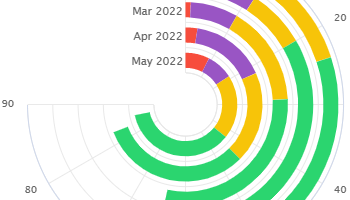
Create Radial Bar Charts on your Jira dashboard by utilizing the ‘Circular Chart’ gadget within the Performance Objectives app. This…
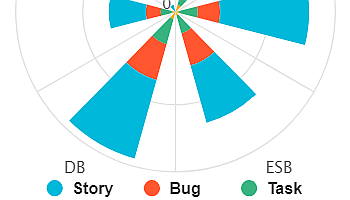
Wind rose chart: Visualize direction and magnitude. Rich display options in Jira for valuable insights and enhanced reporting.
