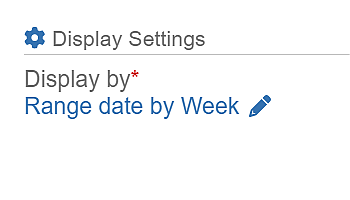
Range Date Field as a Key to Time-Based Data Insights The Range Date is a key Date field, seamlessly integrated…
Range Date Field as a Key to Time-Based Data Insights The Range Date is a key Date field, seamlessly integrated…
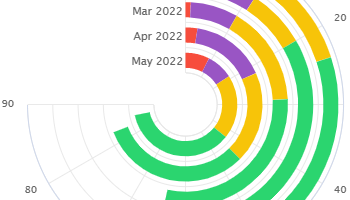
Create Radial Bar Charts on your Jira dashboard by utilizing the ‘Circular Chart’ gadget within the Performance Objectives app. This…
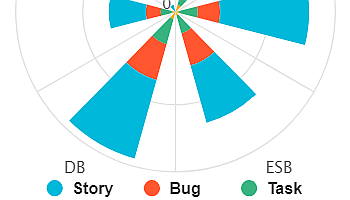
Wind rose chart: Visualize direction and magnitude. Rich display options in Jira for valuable insights and enhanced reporting.
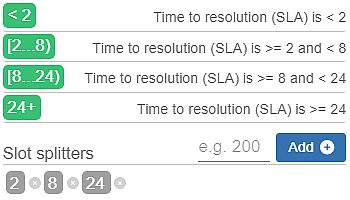
Utilizing Metric Distribution in Performance Objectives Metric Distribution offers a valuable solution when Jira standard charting and tracking tools fail…
Performance Objectives: Charts for Jira empowers you to segment data from multiple sources, enhancing analysis. Key features include customizable multi…