Skip to content
Performance Objectives: Charts for Jira
Powerful reporting app for Jira dashboards
  • Home
  • KPI Examples
  • User Guide
  • Blog
  • YouTube

Category: KPI Reports

First Response Time (FRT) KPI

December 1, 2023 KPI Advisor
FRT Thumb

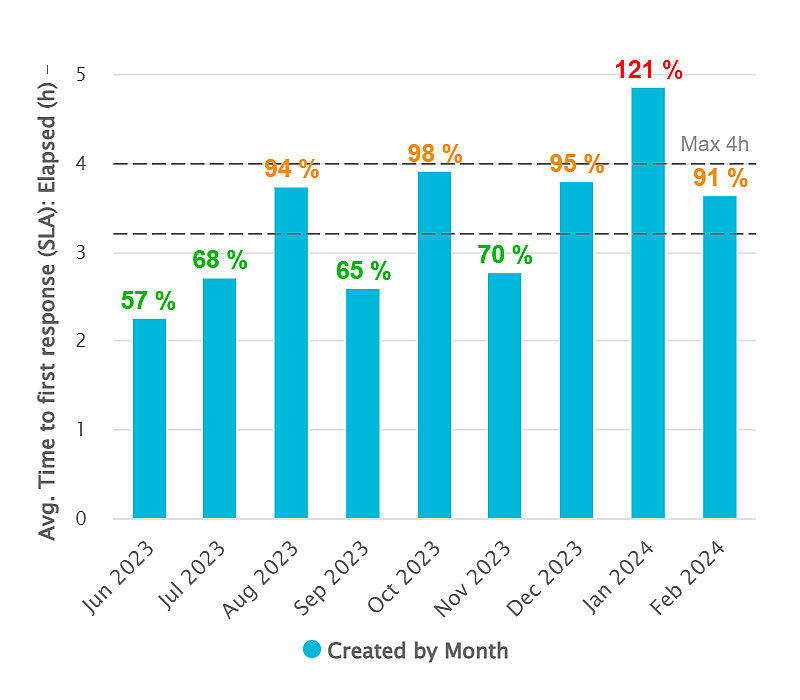
If you operate within a support center or help desk, monitoring the Time to First Response is crucial for evaluating…

Continue Reading →

Posted in: KPI Reports Filed under: All KPIs, Operations KPIs

Rolling Issues vs all KPI

November 29, 2023 KPI Advisor
Thumb rolling vs All issues in Sprint

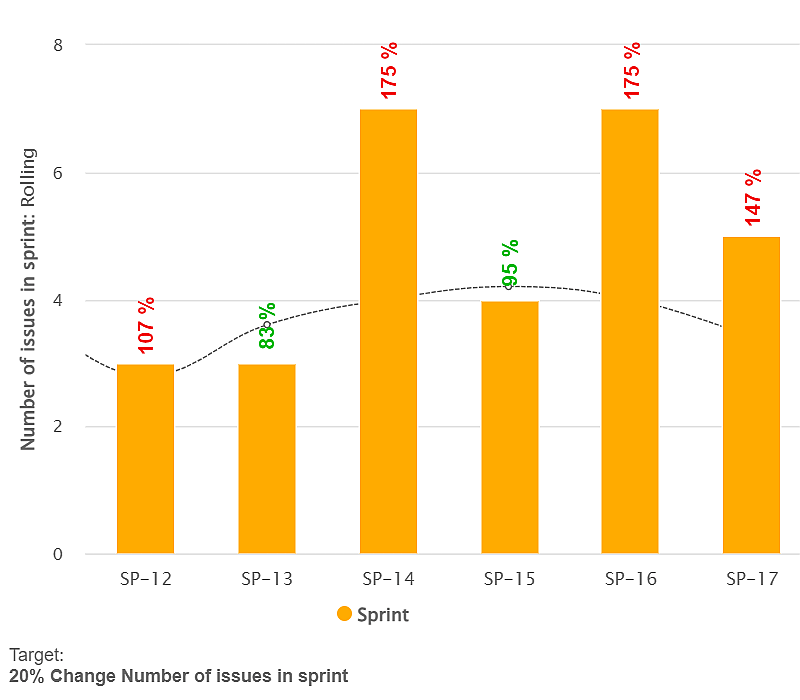
Managing Sprint Rollover: New Filtering Options with the Performance Objectives App The Performance Objectives app revolutionizes how Jira users create…

Continue Reading →

Posted in: KPI Reports Filed under: All KPIs

First Contact Resolution

November 26, 2023 KPI Advisor
FCR Issues thumb

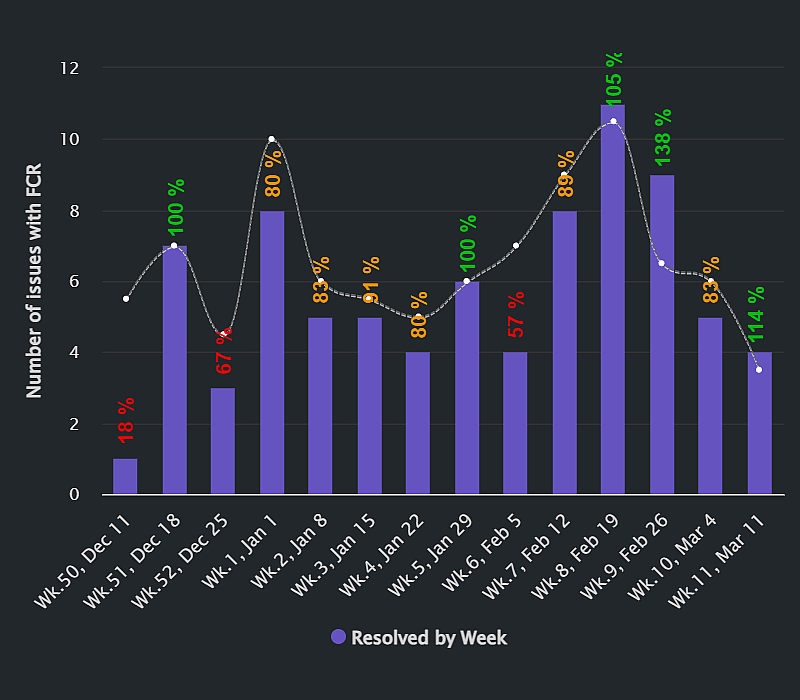
Create report and set target for % of requests resolved on first interaction.

Continue Reading →

Posted in: KPI Reports Filed under: All KPIs, Operations KPIs

Max Issue Age KPI

November 9, 2023 KPI Advisor
Max Issue Age KPI Jira thumb

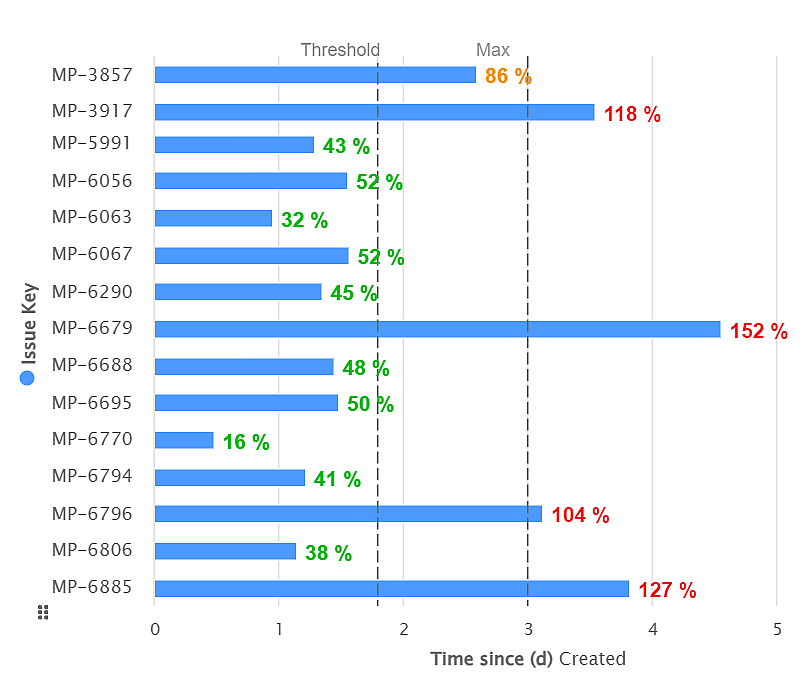
Use ‘Time since’ metric to track time since any standard or custom Jira date field.

Continue Reading →

Posted in: KPI Reports Filed under: All KPIs, Operations KPIs, Project Delivery KPIs

% of High Severity Defects KPI

November 1, 2023 KPI Advisor
Percent of High Severity Defects KPI Thumb dark

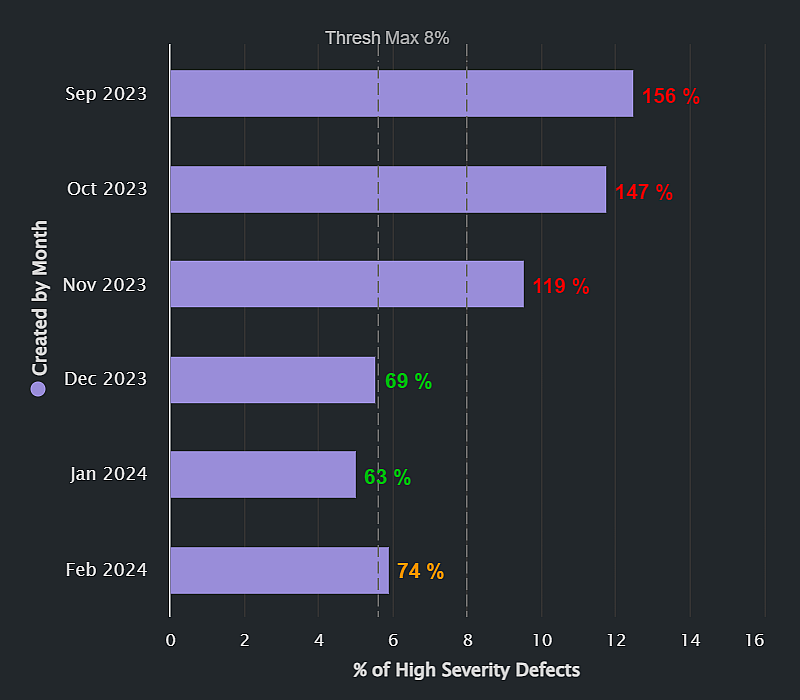
Track the % of High Severity Defects with Performance Objectives in Jira.

Continue Reading →

Posted in: KPI Reports Filed under: All KPIs, Development KPIs, QA KPIs

Time Spent in Rework KPI

October 26, 2023 KPI Advisor
Time Spent In Rework KPI Jira Dashboard Thumb

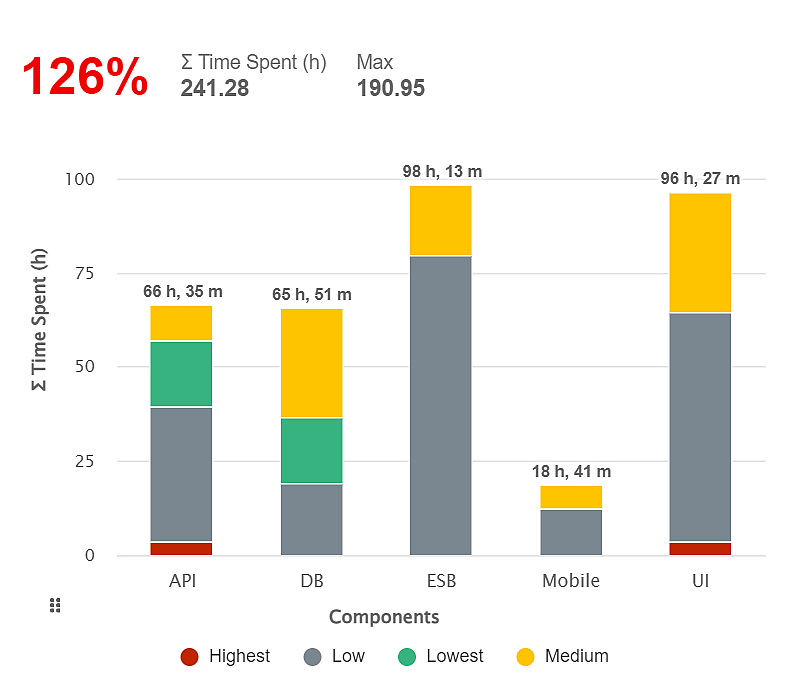
Use Time in Rework Report for efficiency and improvements with Performance Objectives app.

Continue Reading →

Posted in: KPI Reports Filed under: All KPIs, Development KPIs, Project Delivery KPIs, QA KPIs

Personal Velocity KPI

October 1, 2023 KPI Advisor
Personal Velocity KPI Thumb.png

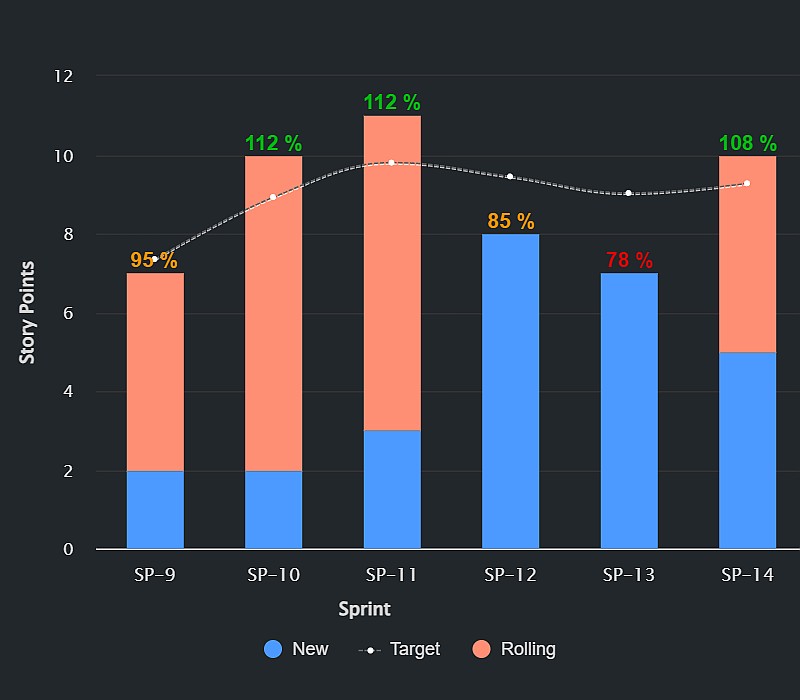
Create Personal Velocity report for insights into individual performance.

Continue Reading →

Posted in: KPI Reports Filed under: All KPIs, Development KPIs

% of Total Story Points KPI

September 17, 2023 KPI Advisor
Percent of Total Story Points KPI Jira Dashboard thumb light

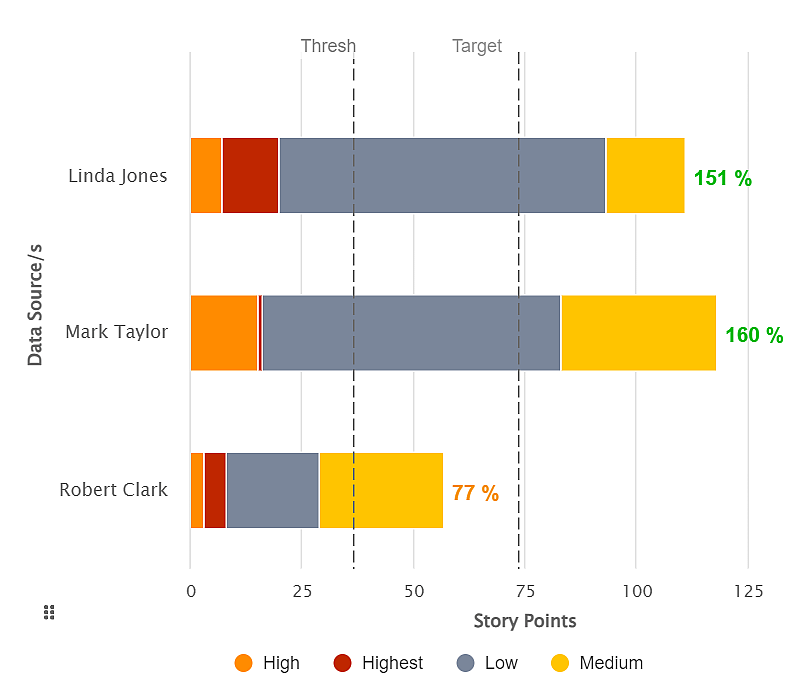
Define personal goals: % of total team Story Points over multiple Sprints.

Continue Reading →

Posted in: KPI Reports Filed under: All KPIs, Development KPIs, Project Delivery KPIs

PoP Improvement KPI

September 2, 2023 KPI Advisor
Period over Period Improvement KPI Report Jira Dashboard thumb

Create a PoP Improvement Report with Bug Reduction Goal with Performance Objectives app.

Continue Reading →

Posted in: KPI Reports Filed under: All KPIs, Project Delivery KPIs

Decrease the Number of Cycles

August 21, 2023 KPI Advisor
Decrease Cycles in Status KPI Jira thumb 2

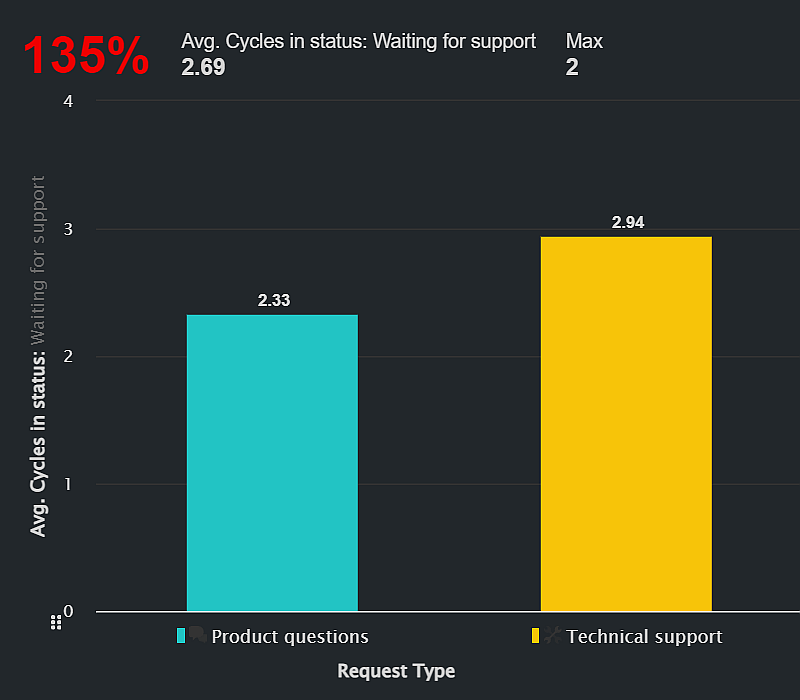
Gain insights via Status Count analysis for enhanced team performance.

Continue Reading →

Posted in: KPI Reports Filed under: All KPIs, Operations KPIs

Post navigation

Page 2 of 3
← Previous 1 2 3 Next →

BY CATEGORY

  • expandBlog
  • expandGetting Started
  • collapseKPI Reports
    • % of High Severity Defects KPI
    • % of Total Story Points KPI
    • Agile Team Velocity KPI
    • Average Time in Status in Sprint
    • Bounce Back Rate
    • Budget vs Actual Cost Report in Jira
    • Bugs missed by Engineering
    • Committed Rolling vs Completed KPI
    • Complexity vs Performance KPI
    • Created vs Resolved vs Any Date
    • Cycle Time KPI
    • Decrease the Number of Cycles
    • Defect Removal Efficiency (DRE)
    • Defects Severity Index
    • Dynamic goal-setting with MA
    • First Contact Resolution
    • First Response Time (FRT) KPI
    • Max Issue Age KPI
    • Mean Time to Resolve (MTTR)
    • Personal Velocity KPI
    • PoP Comparison through % Change
    • PoP Improvement KPI
    • Punctuality of Reported Defects
    • Rolling Issues vs all KPI
    • Say-Do Ratio KPI
    • Sprint Rollover Ratio KPI
    • Support requests report by time of day
    • Time Spent in Rework KPI
    • Tracking SLA Breaches in Jira Service Management
    • Worklog Time KPI
  • expandSettings
    • expandCustomization
    • expandDashboard Gadgets
    • expandData Grouping
    • expandData Segmentation
    • expandMetrics
    • expandTargets

BY TAG

  • expandAll
  • expandAll KPIs
  • expandData Analysis
  • expandDevelopment KPIs
  • expandGadgets
  • expandGetting started
  • expandGoals
  • expandMetrics
  • expandOperations KPIs
  • expandProject Delivery KPIs
  • expandQA KPIs
  • expandStyling
LEGEND
pin
Number
calendar_month
Date
timer
Time
abc
Text
people
User
M
Metric
F
Field
lock_open
Dependent Field
check
Supported
horizontal_rule
Not Supported
stacked_bar_chart
Performance Objectives Gadget
area_chart
Performance Trend Gadget
donut_small
Circular Chart Gadget
ssid_chart
Multi Metric Trend Gadget
shape_line
Multi Metric Combined Gadget
scatter_plot
Scatter & Bubble Chart Gadget
space_dashboard
Tree Map Gadget
join_full
Venn Diagramm Gadget
blur_on
Heat Map Gadget
history
Change History Gadget
  • Privacy
  • Support
  • Marketplace
  • SLA
  • EULA
  • Security
  • Status
COOKIE AND PRIVACY POLICY
Copyright © 2024 DevAcrobats Ltd. All rights reserved.