Table of Contents
Bounce Back Rate: Why It Matters
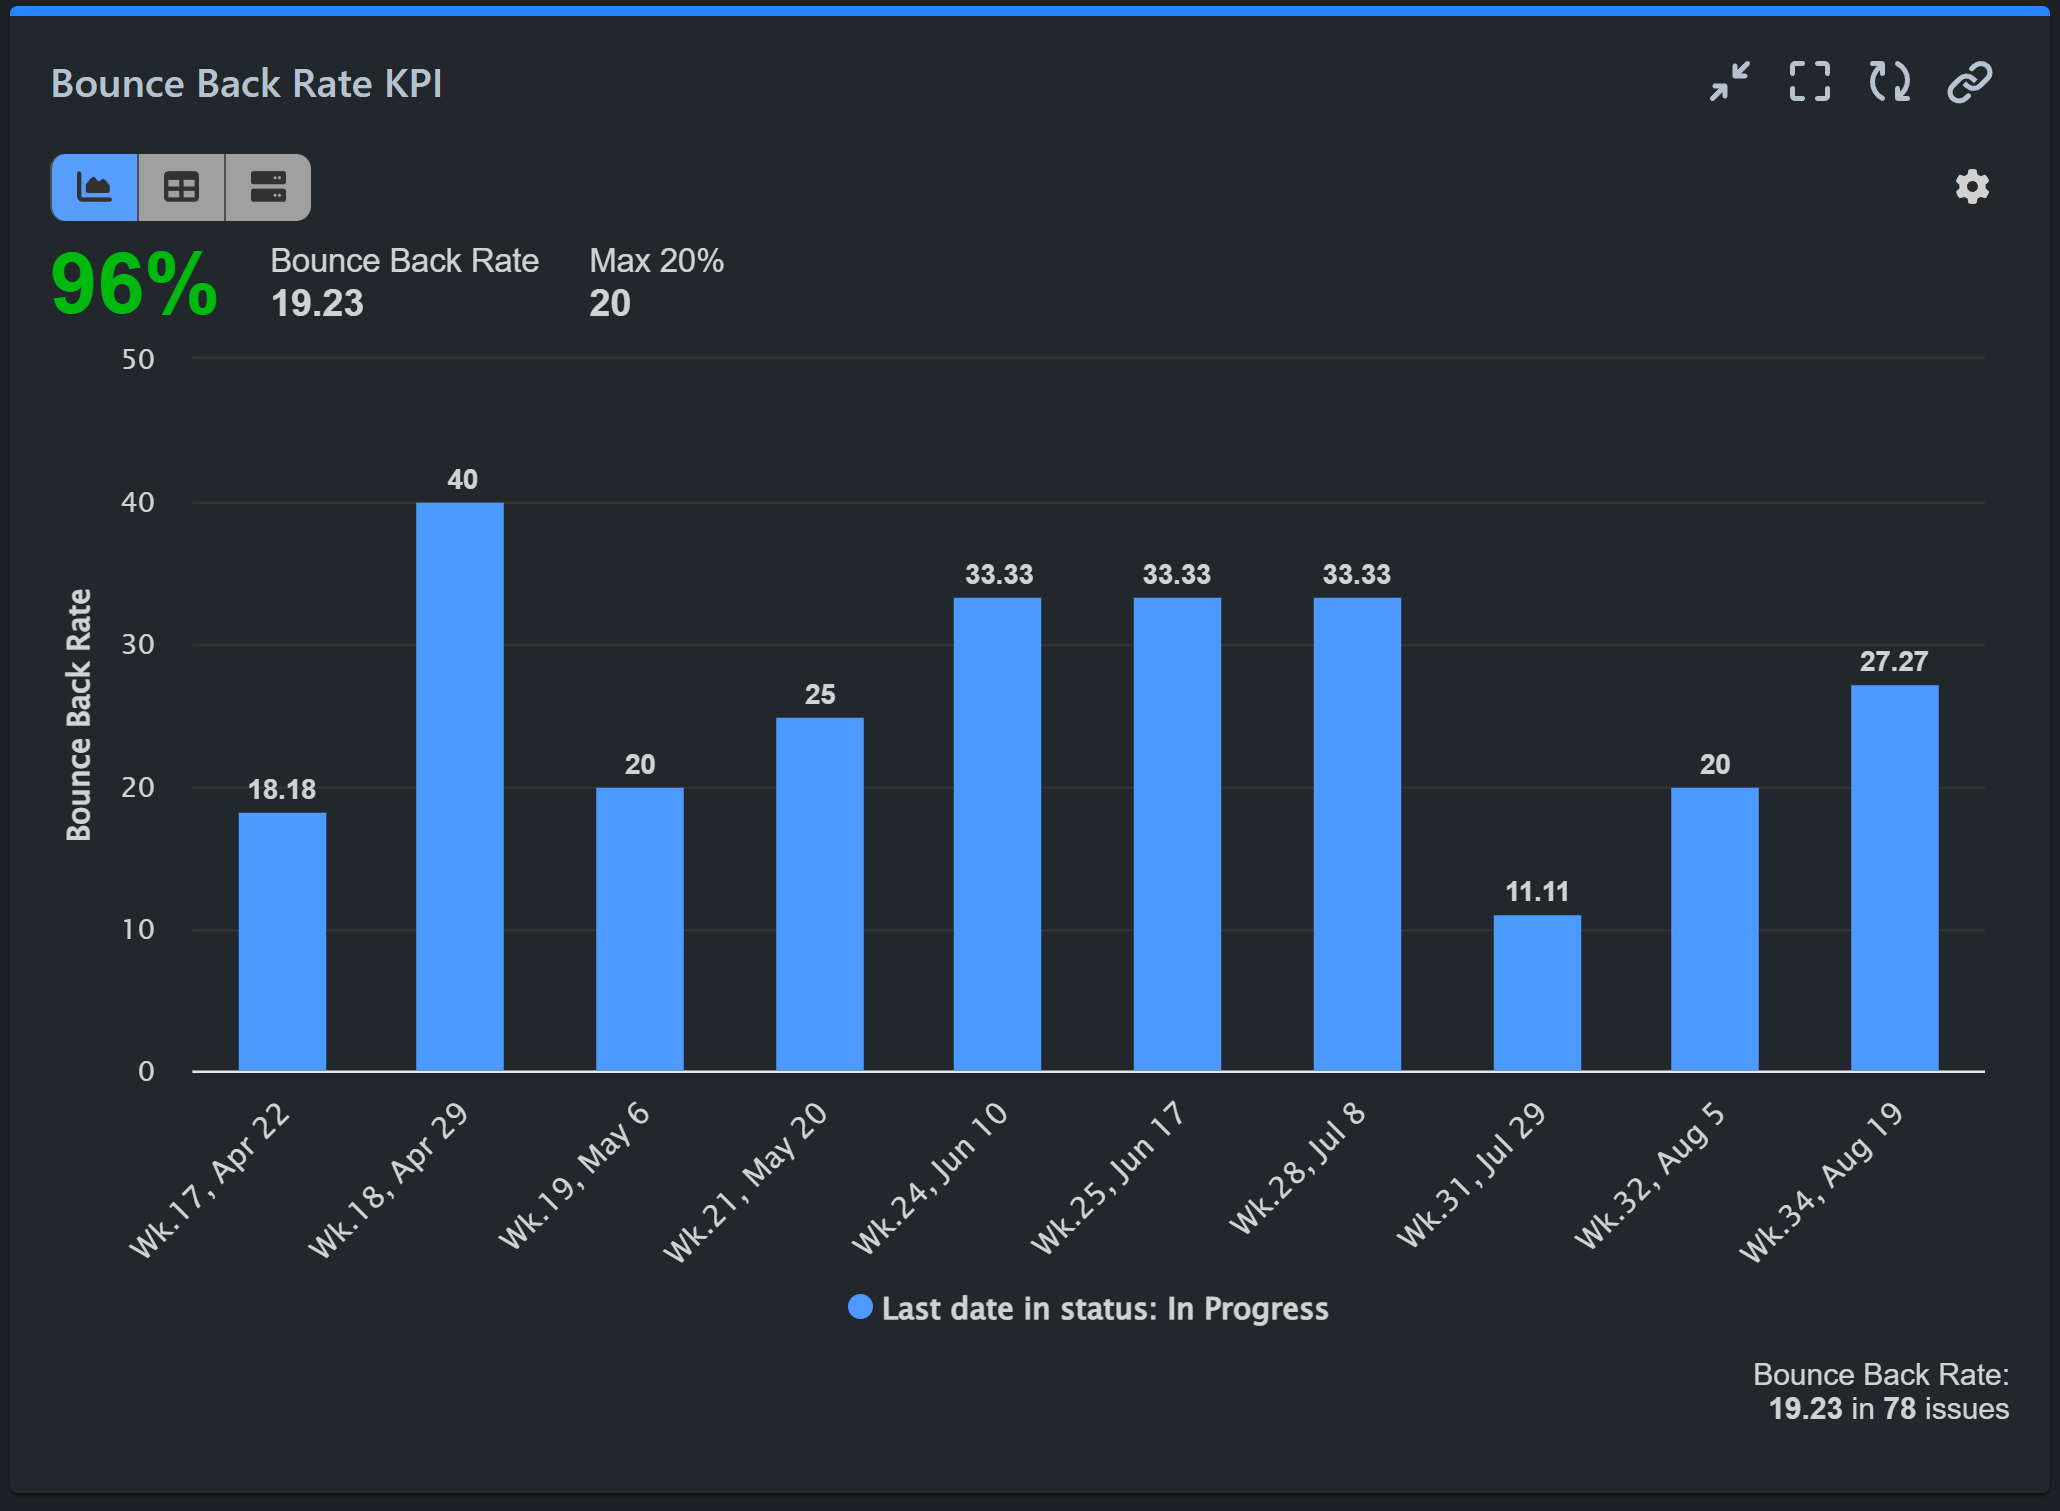
In agile project management, the Bounce Back Rate is a vital key performance indicator (KPI) that highlights potential issues in your workflow. This metric tracks the percentage of tasks or issues that revert to a previous status (like “In Progress”) after advancing in the process (like in “Review”, “Testing”, “Done”, or other).
Monitoring the Bounce Back Rate in Jira is essential because a high rate often signals underlying problems, such as unclear requirements, insufficient reviews, or inadequate task preparation. Such disruptions in the workflow can lead to delays, increased costs, and reduced team morale. By regularly observing this KPI, teams can identify bottlenecks, refine their review processes, and ultimately enhance the overall quality and efficiency of their projects. Keeping an eye on the Bounce Back Rate helps teams address issues proactively and maintain a smoother, more effective workflow.
Creating a Bounce Back Rate Report with the Performance Objectives App in Jira
Here’s how you can set up and interpret this report to ensure your team stays on track and addresses any issues promptly.
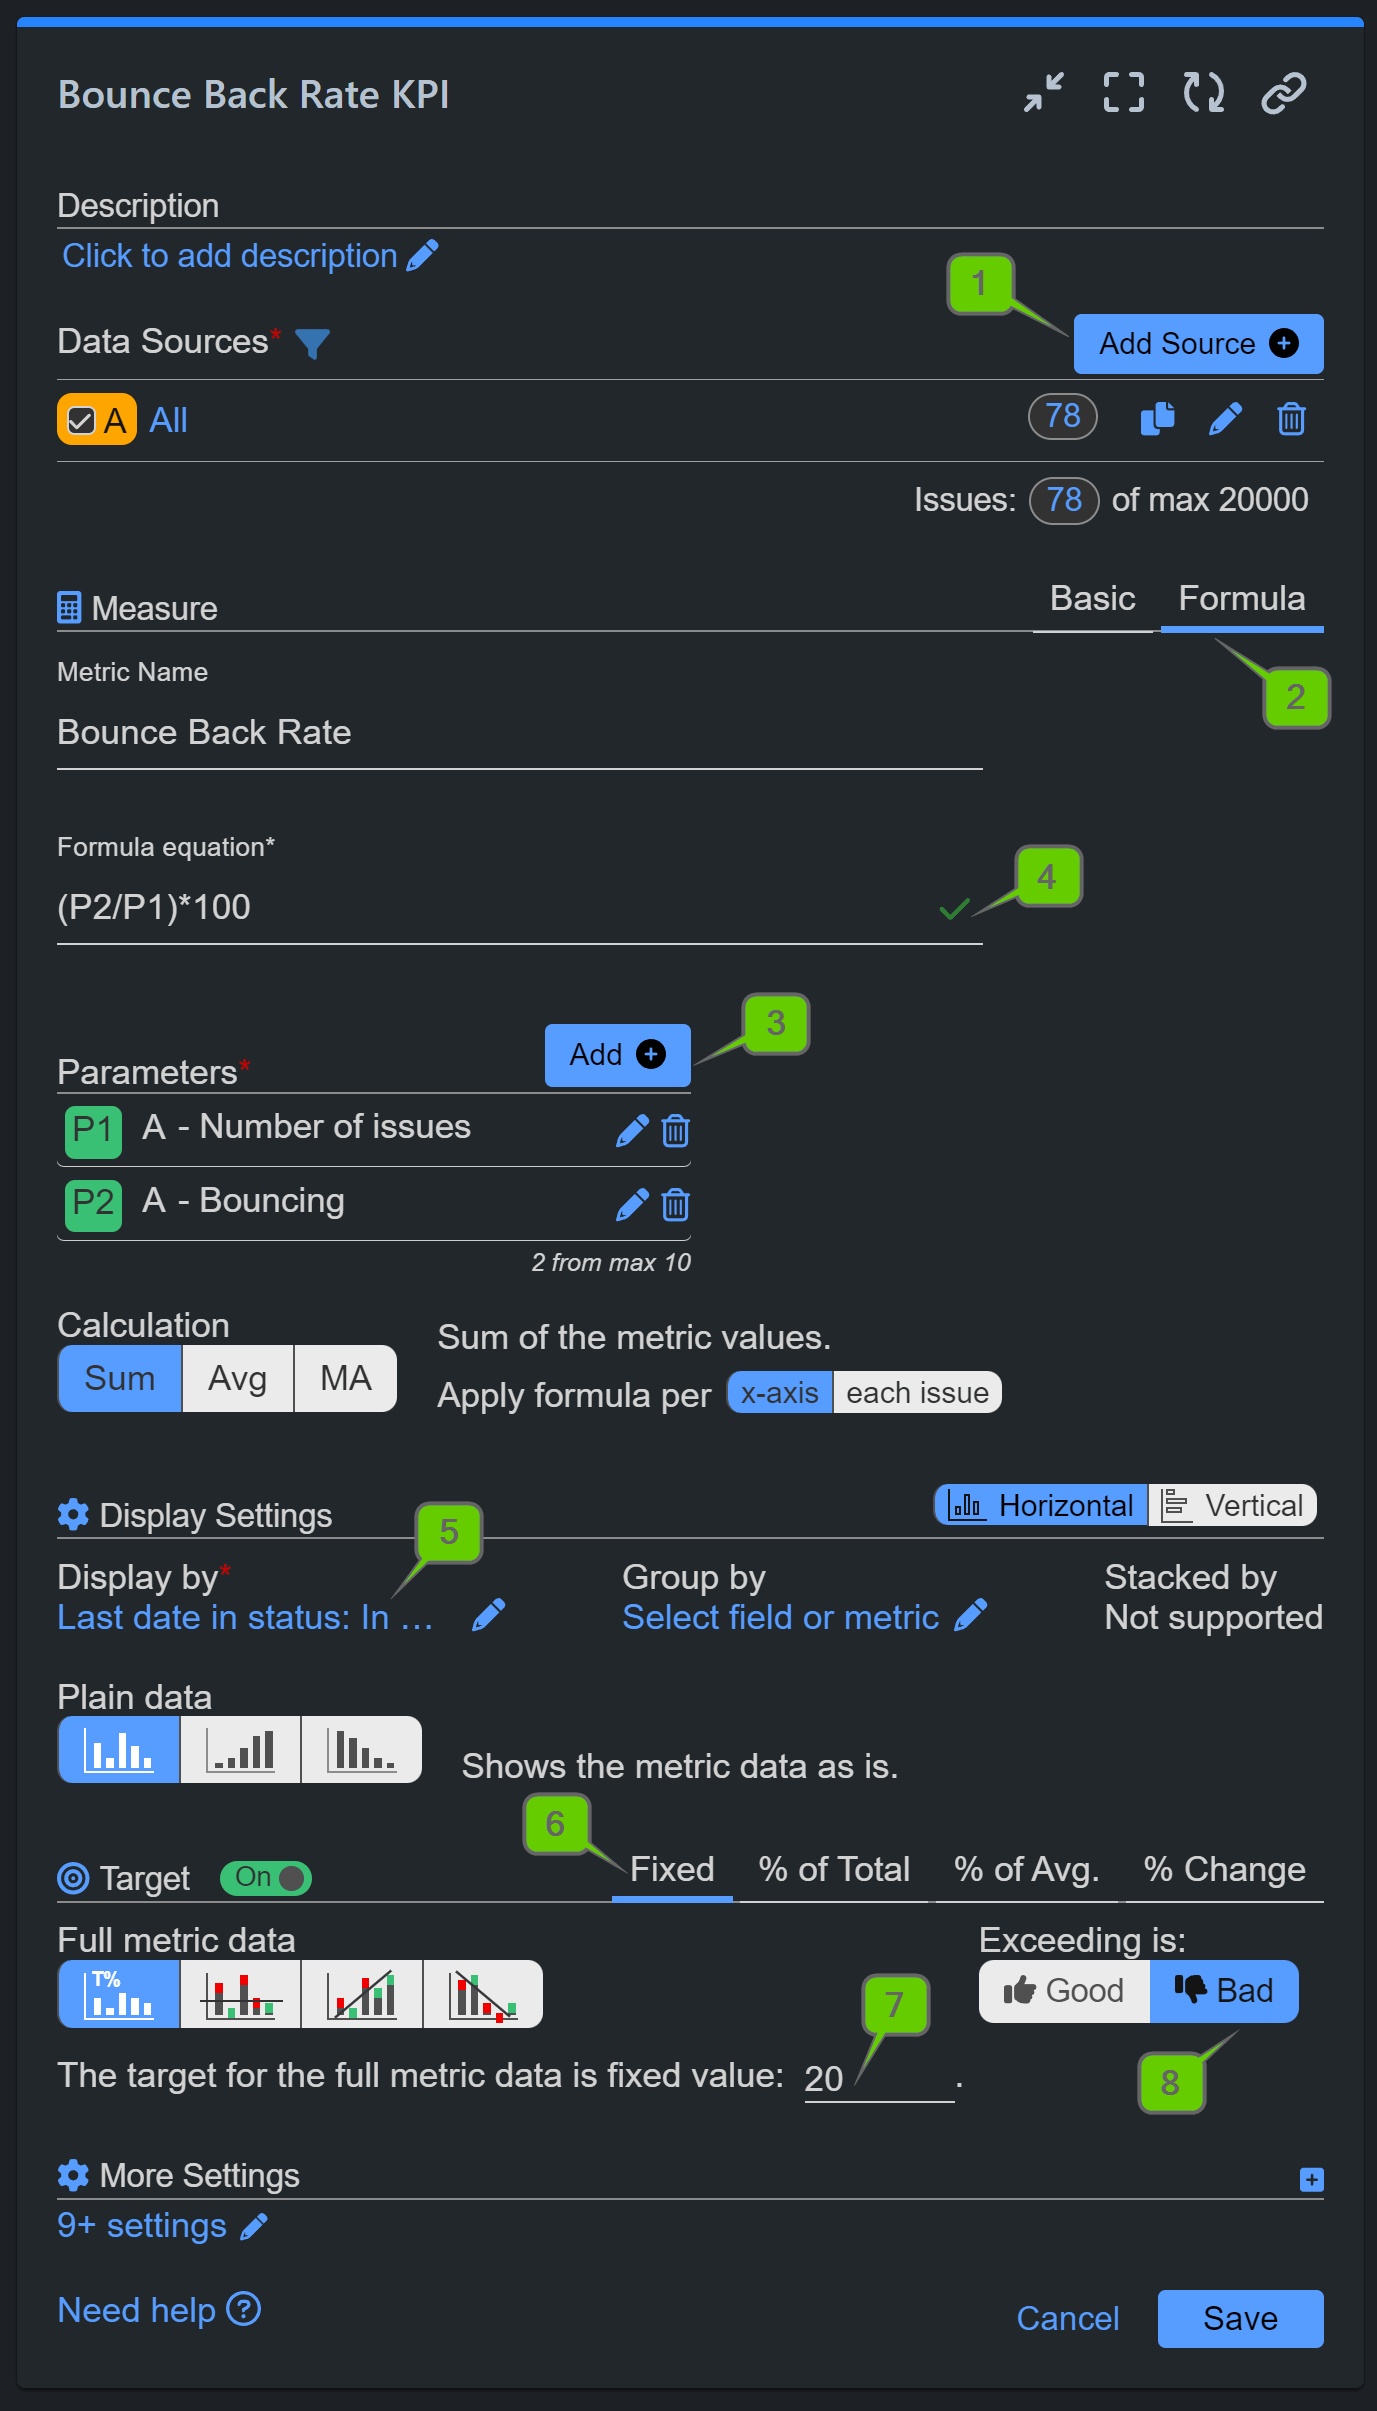
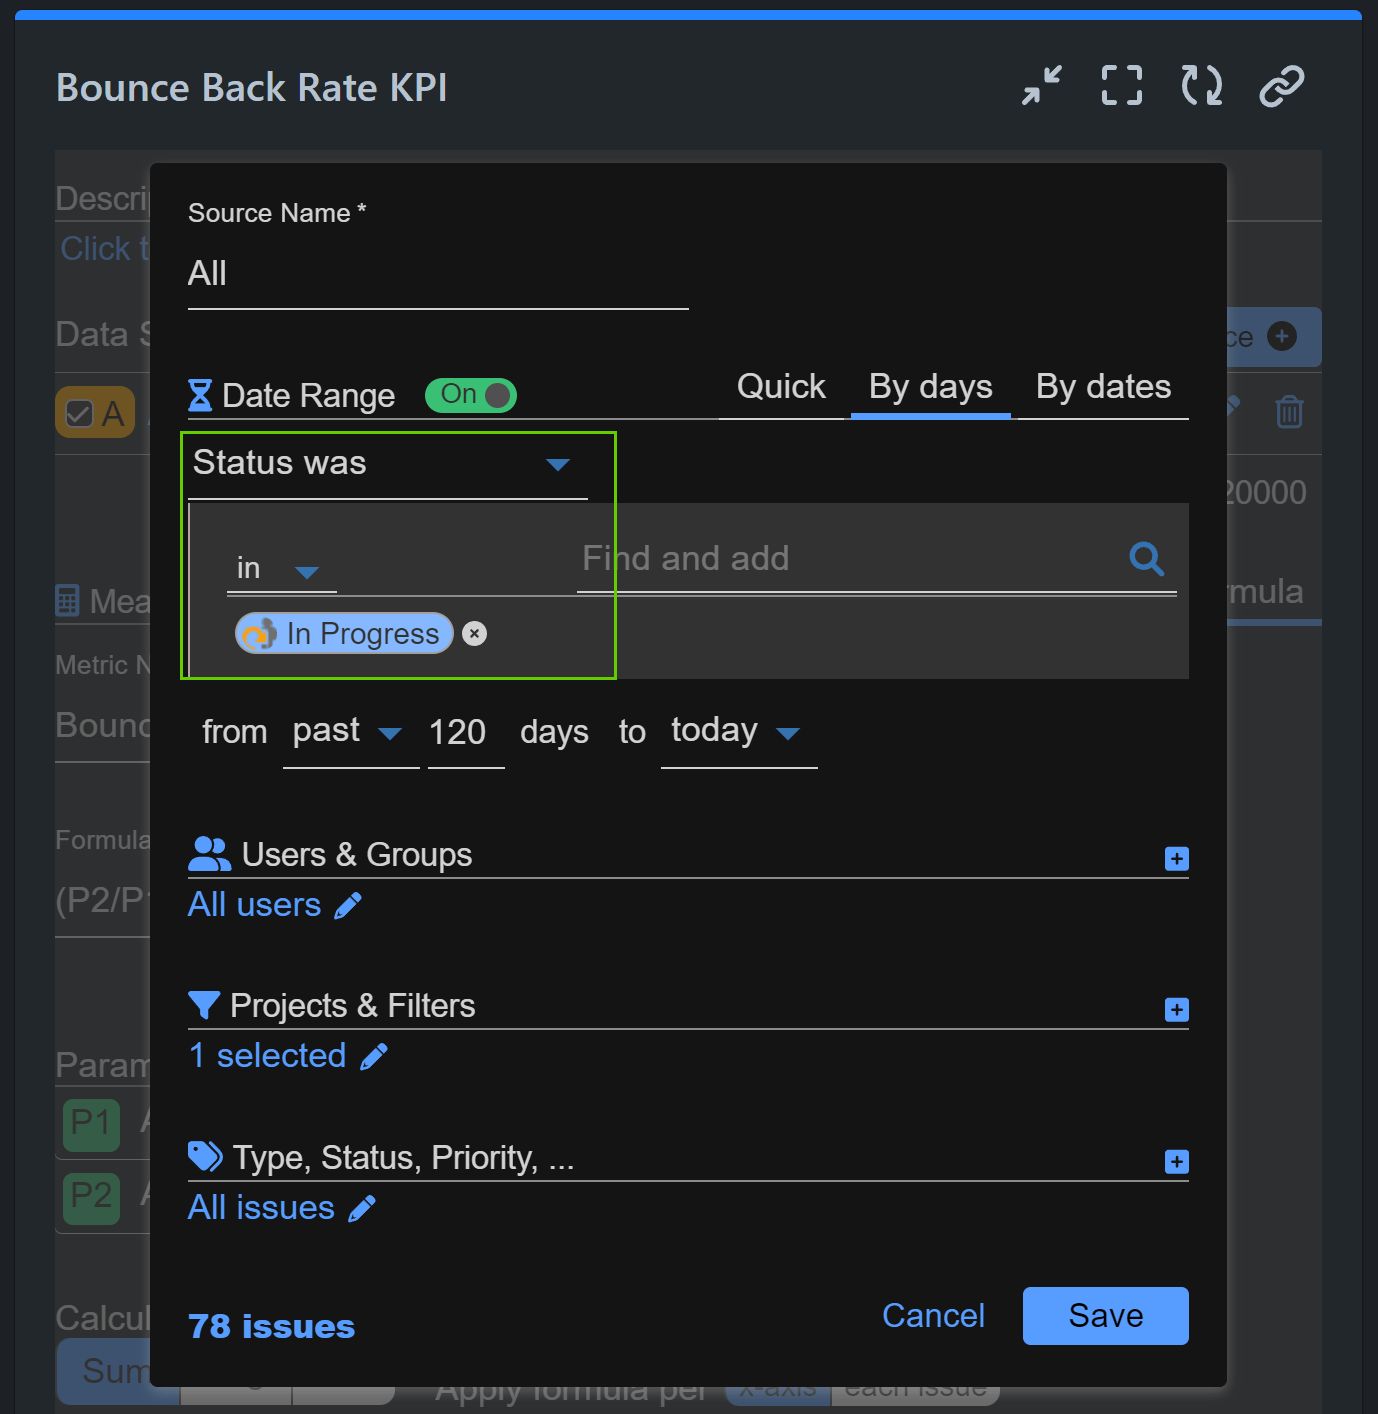
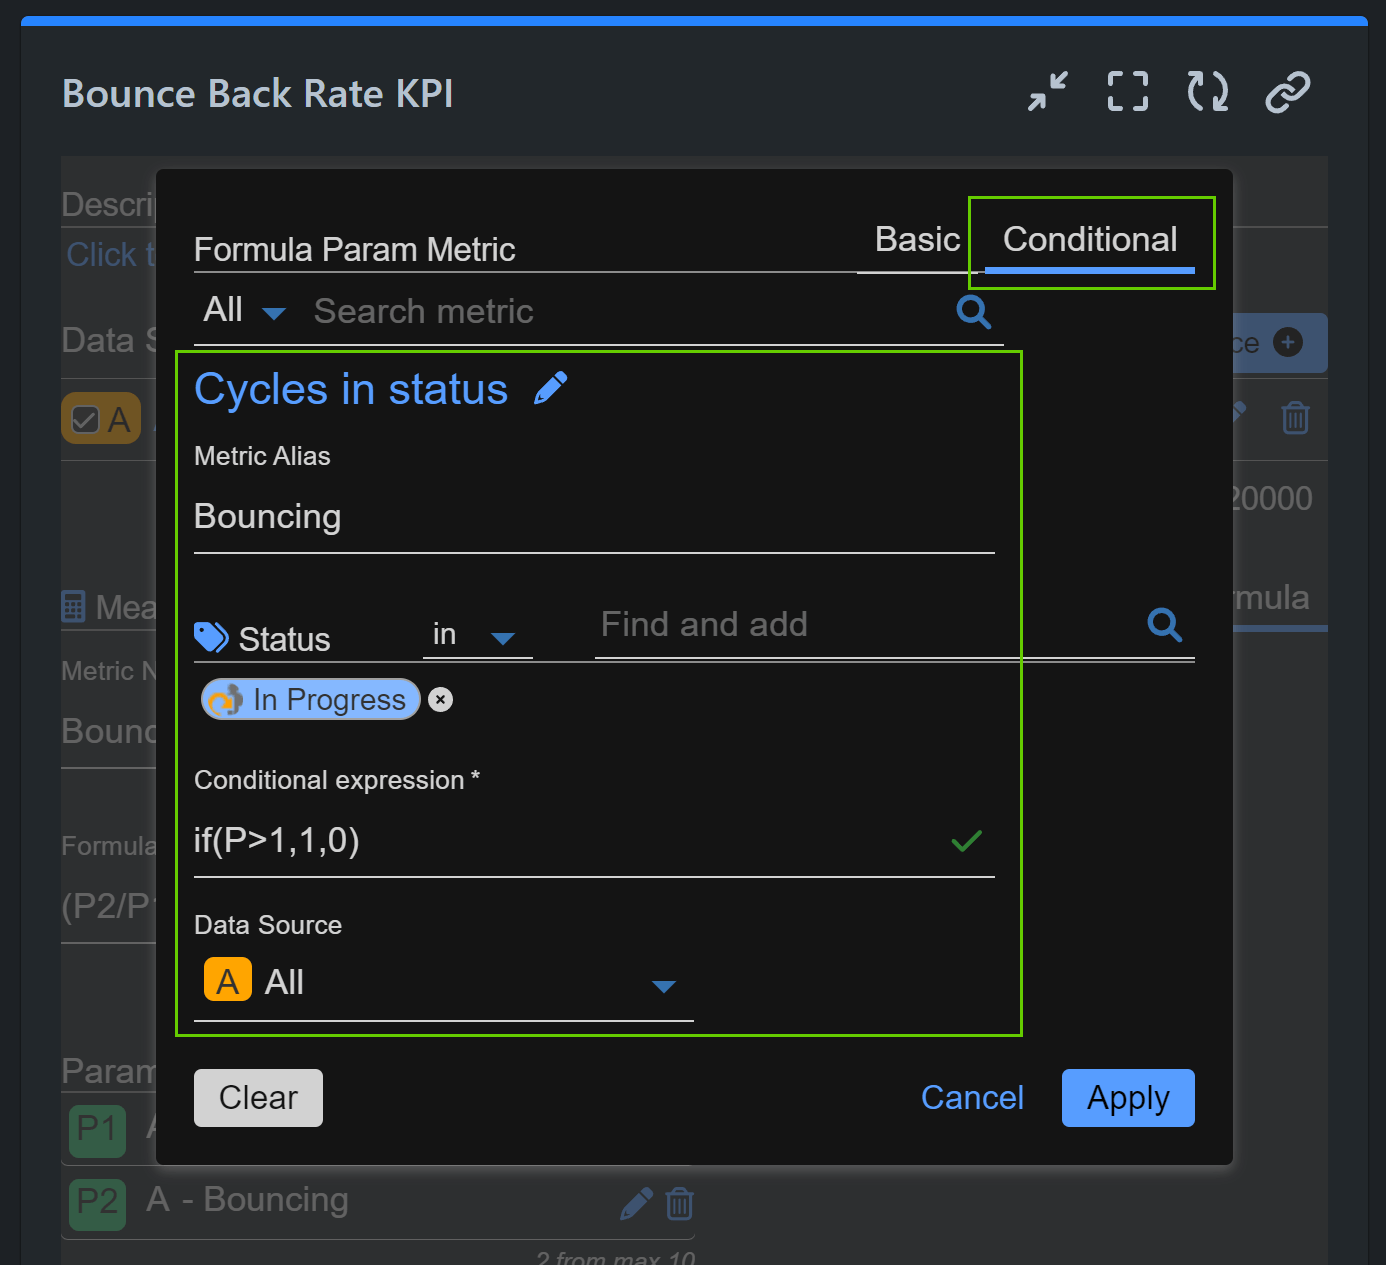
In configuring the report, we used the dynamic “Status was” field to identify issues that were in the ‘In Progress’ status during the defined period. This approach establishes the starting point for our analysis. To calculate the Bounce Back Rate, we employed a formula metric that measures the ratio of issues that reverted to “In Progress” after advancing through other statuses. We determined this rate by using a conditional metric to isolate these bounced-back issues.
For visualization, we set the “Last date in status” field on the x-axis. This setup allows us to track the frequency of bounce backs over time, offering clear insights into workflow disruptions. We established a maximum target of 20% for the Bounce Back Rate, ensuring that any deviations beyond this threshold are promptly addressed with corrective actions.
Step 1: In the Date Range of the data source, select ‘Status was in’ and specify “In Progress.” For this analysis, we’re focusing on data from the past 120 days within our demo project.
Step 2: Navigate to the Formula Metric tab and add a name for the formula metric.
Step 3: Add two formula parameters:
- P1: Basic metric ‘Number of issues.’
- P2: Conditional metric ‘Cycles in status’ – status “In Progress,” using the condition
if(P > 1, 1, 0).
Step 4: Enter the formula equation (P2 / P1) * 100 to calculate the formula metric.
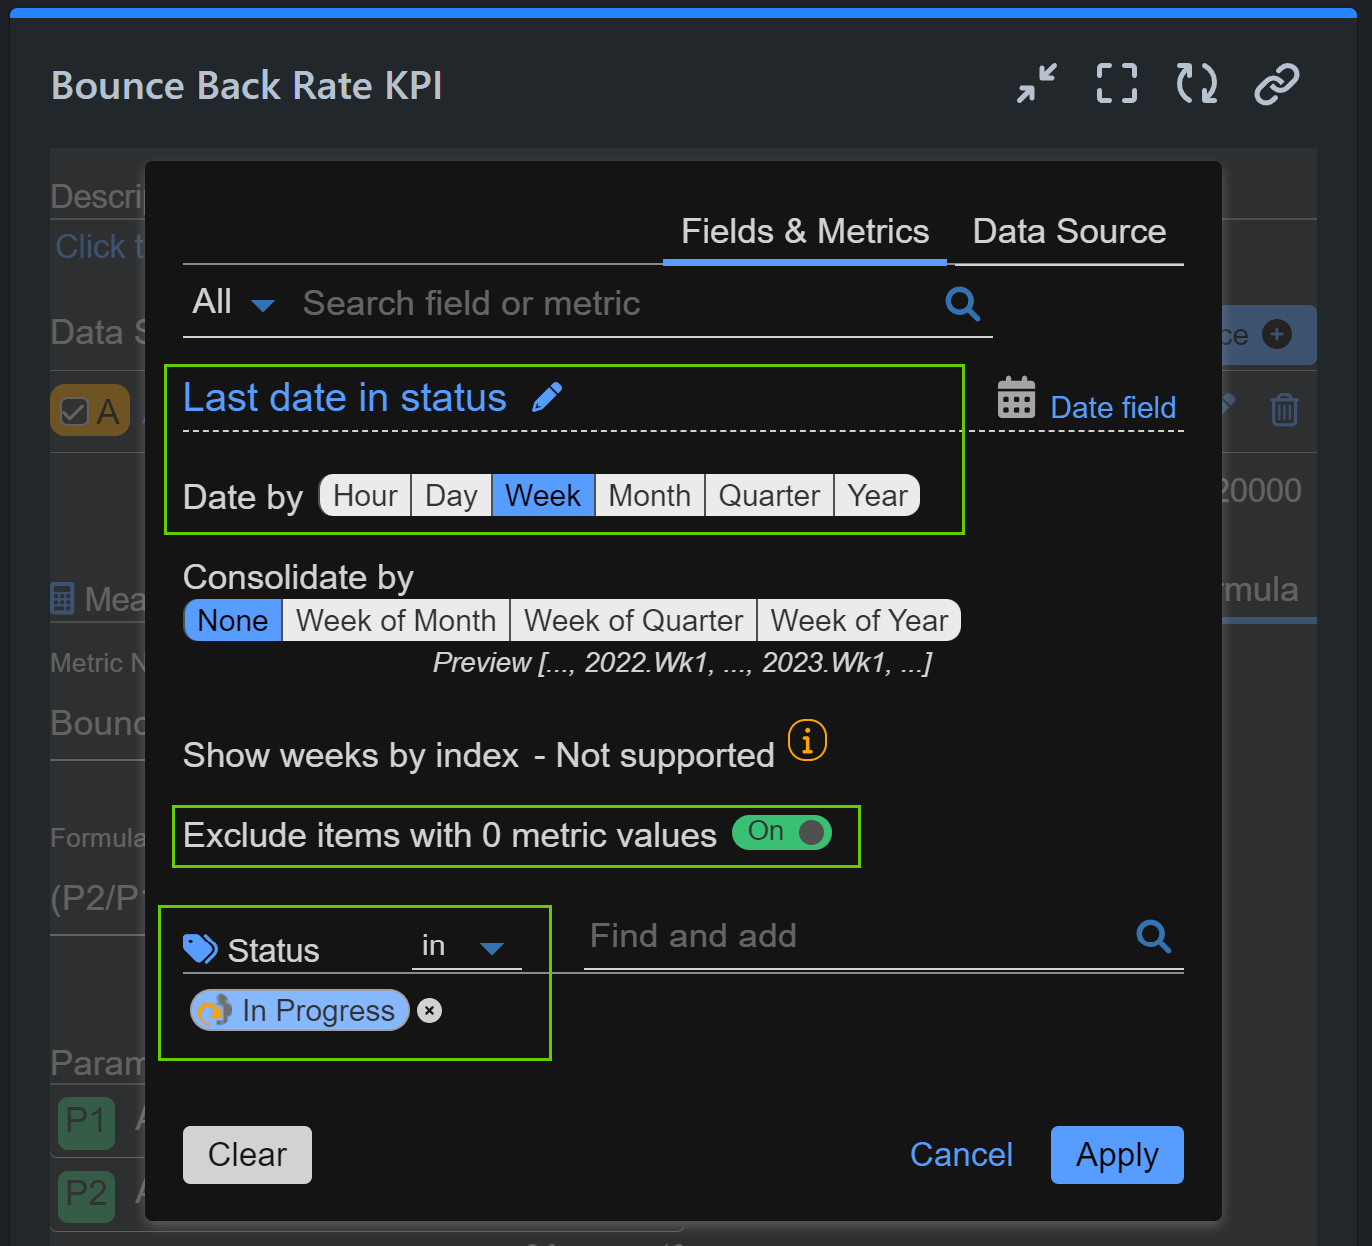
Step 5: For the Display By option, select the date field ‘Last date in status’ and choose the status “In Progress.” In this case, we’ve excluded empty dates by activating the “Exclude items with Zero metric values” option.
Step 6: Activate the Target feature and set the type to Fixed.
Step 7: Select Full Metric for the target result and input the target value, which in this case is 20.
Step 8: Specify that exceeding the target value is considered “Bad,” making it a maximum threshold.
Step 1: Data source settings
Step 3: Conditional metric
Step 5: Display by settings
A Bounce Back Rate that exceeds your target may indicate that issues are not being thoroughly reviewed or understood before moving forward. Addressing these concerns promptly can prevent further delays and improve overall project quality.
In our blog, discover why monitoring bouncing issues in Jira is essential and how they differ from reopened issues.
Explore additional KPI reports for Jira, or watch our YouTube video tutorials on Jira reporting.
Start your 30 days free trial of Performance Objectives: Charts for Jira from Atlassian Marketplace.