Table of Contents
The First Contact Resolution, or FCR rate, measures the percentage of customer requests resolved during the initial interaction, eliminating the need for further follow-up discussions or escalations.
By tracking First Contact Resolution in Jira, along with reopened issue rates, and customer satisfaction, you can establish a comprehensive measurement framework for your IT service. In this article, we will present three effective methods for acquiring invaluable FCR insights using the Performance Objectives: Charts for Jira app.
Tracking First Contact Resolution in Jira (FCR Rate) using the Performance Objectives Gadget
Determining the First Contact Resolution (FCR) rate within Jira plays a crucial role in assessing the efficacy of your service management teams. This evaluation guarantees swift issue resolution during initial interactions, resulting in heightened customer satisfaction, streamlined support processes, and heightened operational efficiency.
Here’s a comprehensive guide to measuring your team’s First Contact Resolution (FCR) rate using the Performance Objectives Gadget:
- Understanding FCR Rate Calculation: Begin by grasping the core components of the FCR rate calculation. This involves determining the count of issues resolved within a single support interaction and the total number of resolved issues within your chosen timeframe.
- Resolving Issues in One Interaction: To filter the issues resolved in a single interaction, use the ‘Cycles in status’ metric alongside a conditional expression (referred to as P1 or Parameter 1 in the formula equation). The specific condition you’ll use, if(P>1,0,1), counts only those issues with one cycle in the selected status. For instance, we are using the “Waiting for support” status in our test project, but you can adapt the “Status in” parameter according to your workflow’s unique stages.
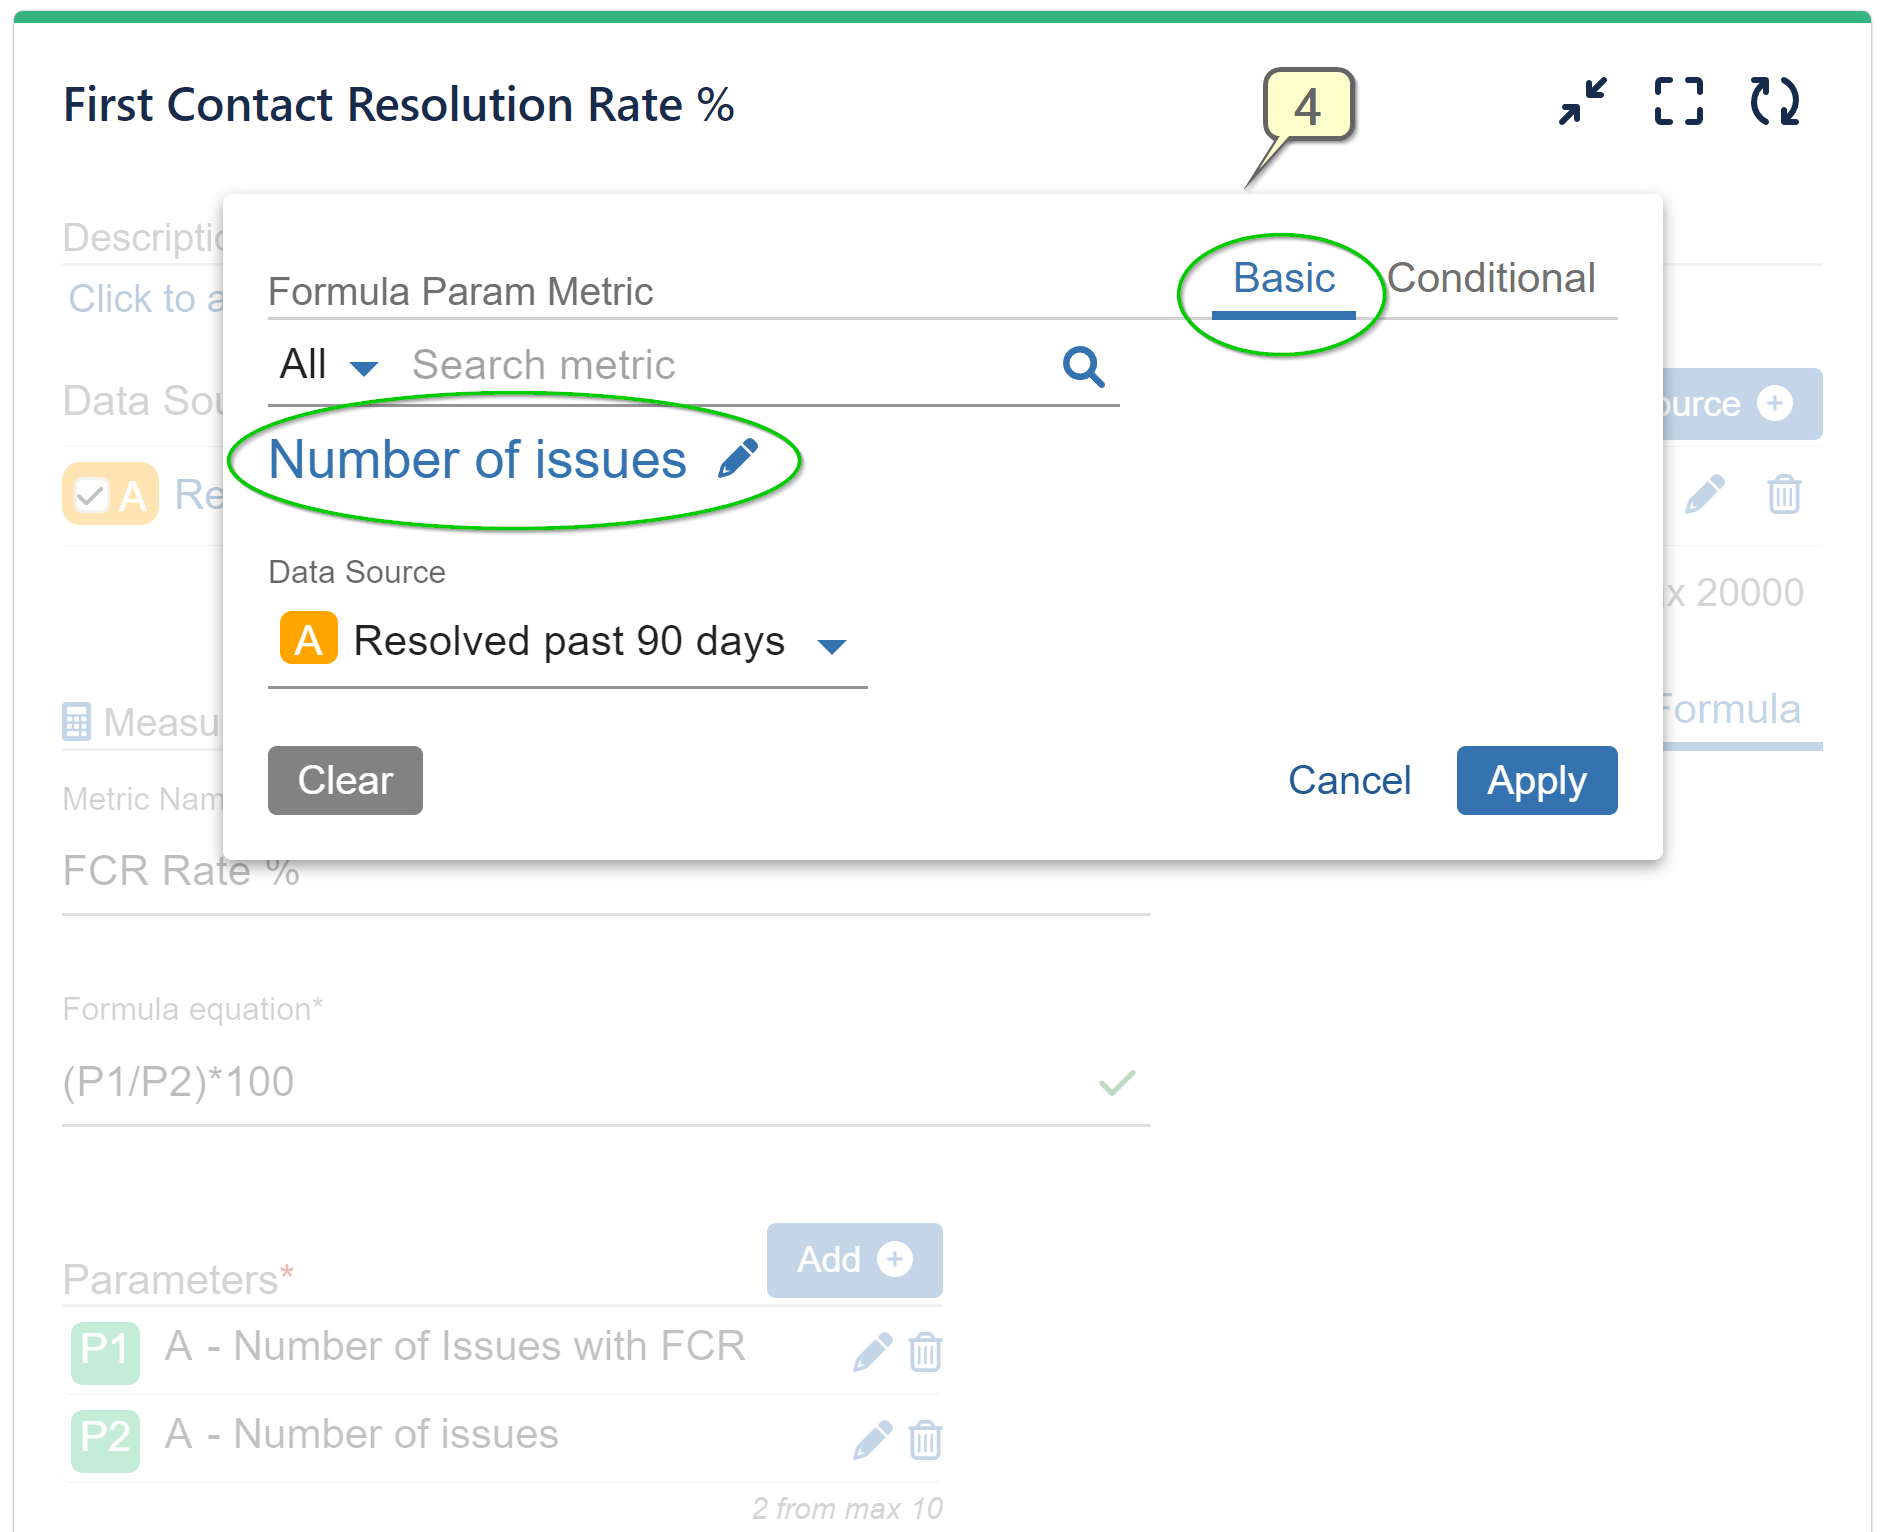
- Incorporating Total Issue Count: Next, add the ‘Number of issues’ metric to count all resolved issues (this is our P2 – Parameter 2 in the formula equation).
- Finalizing the FCR Formula: To derive the First Contact Resolution rate (%), apply the formula (P1/P2)*100.
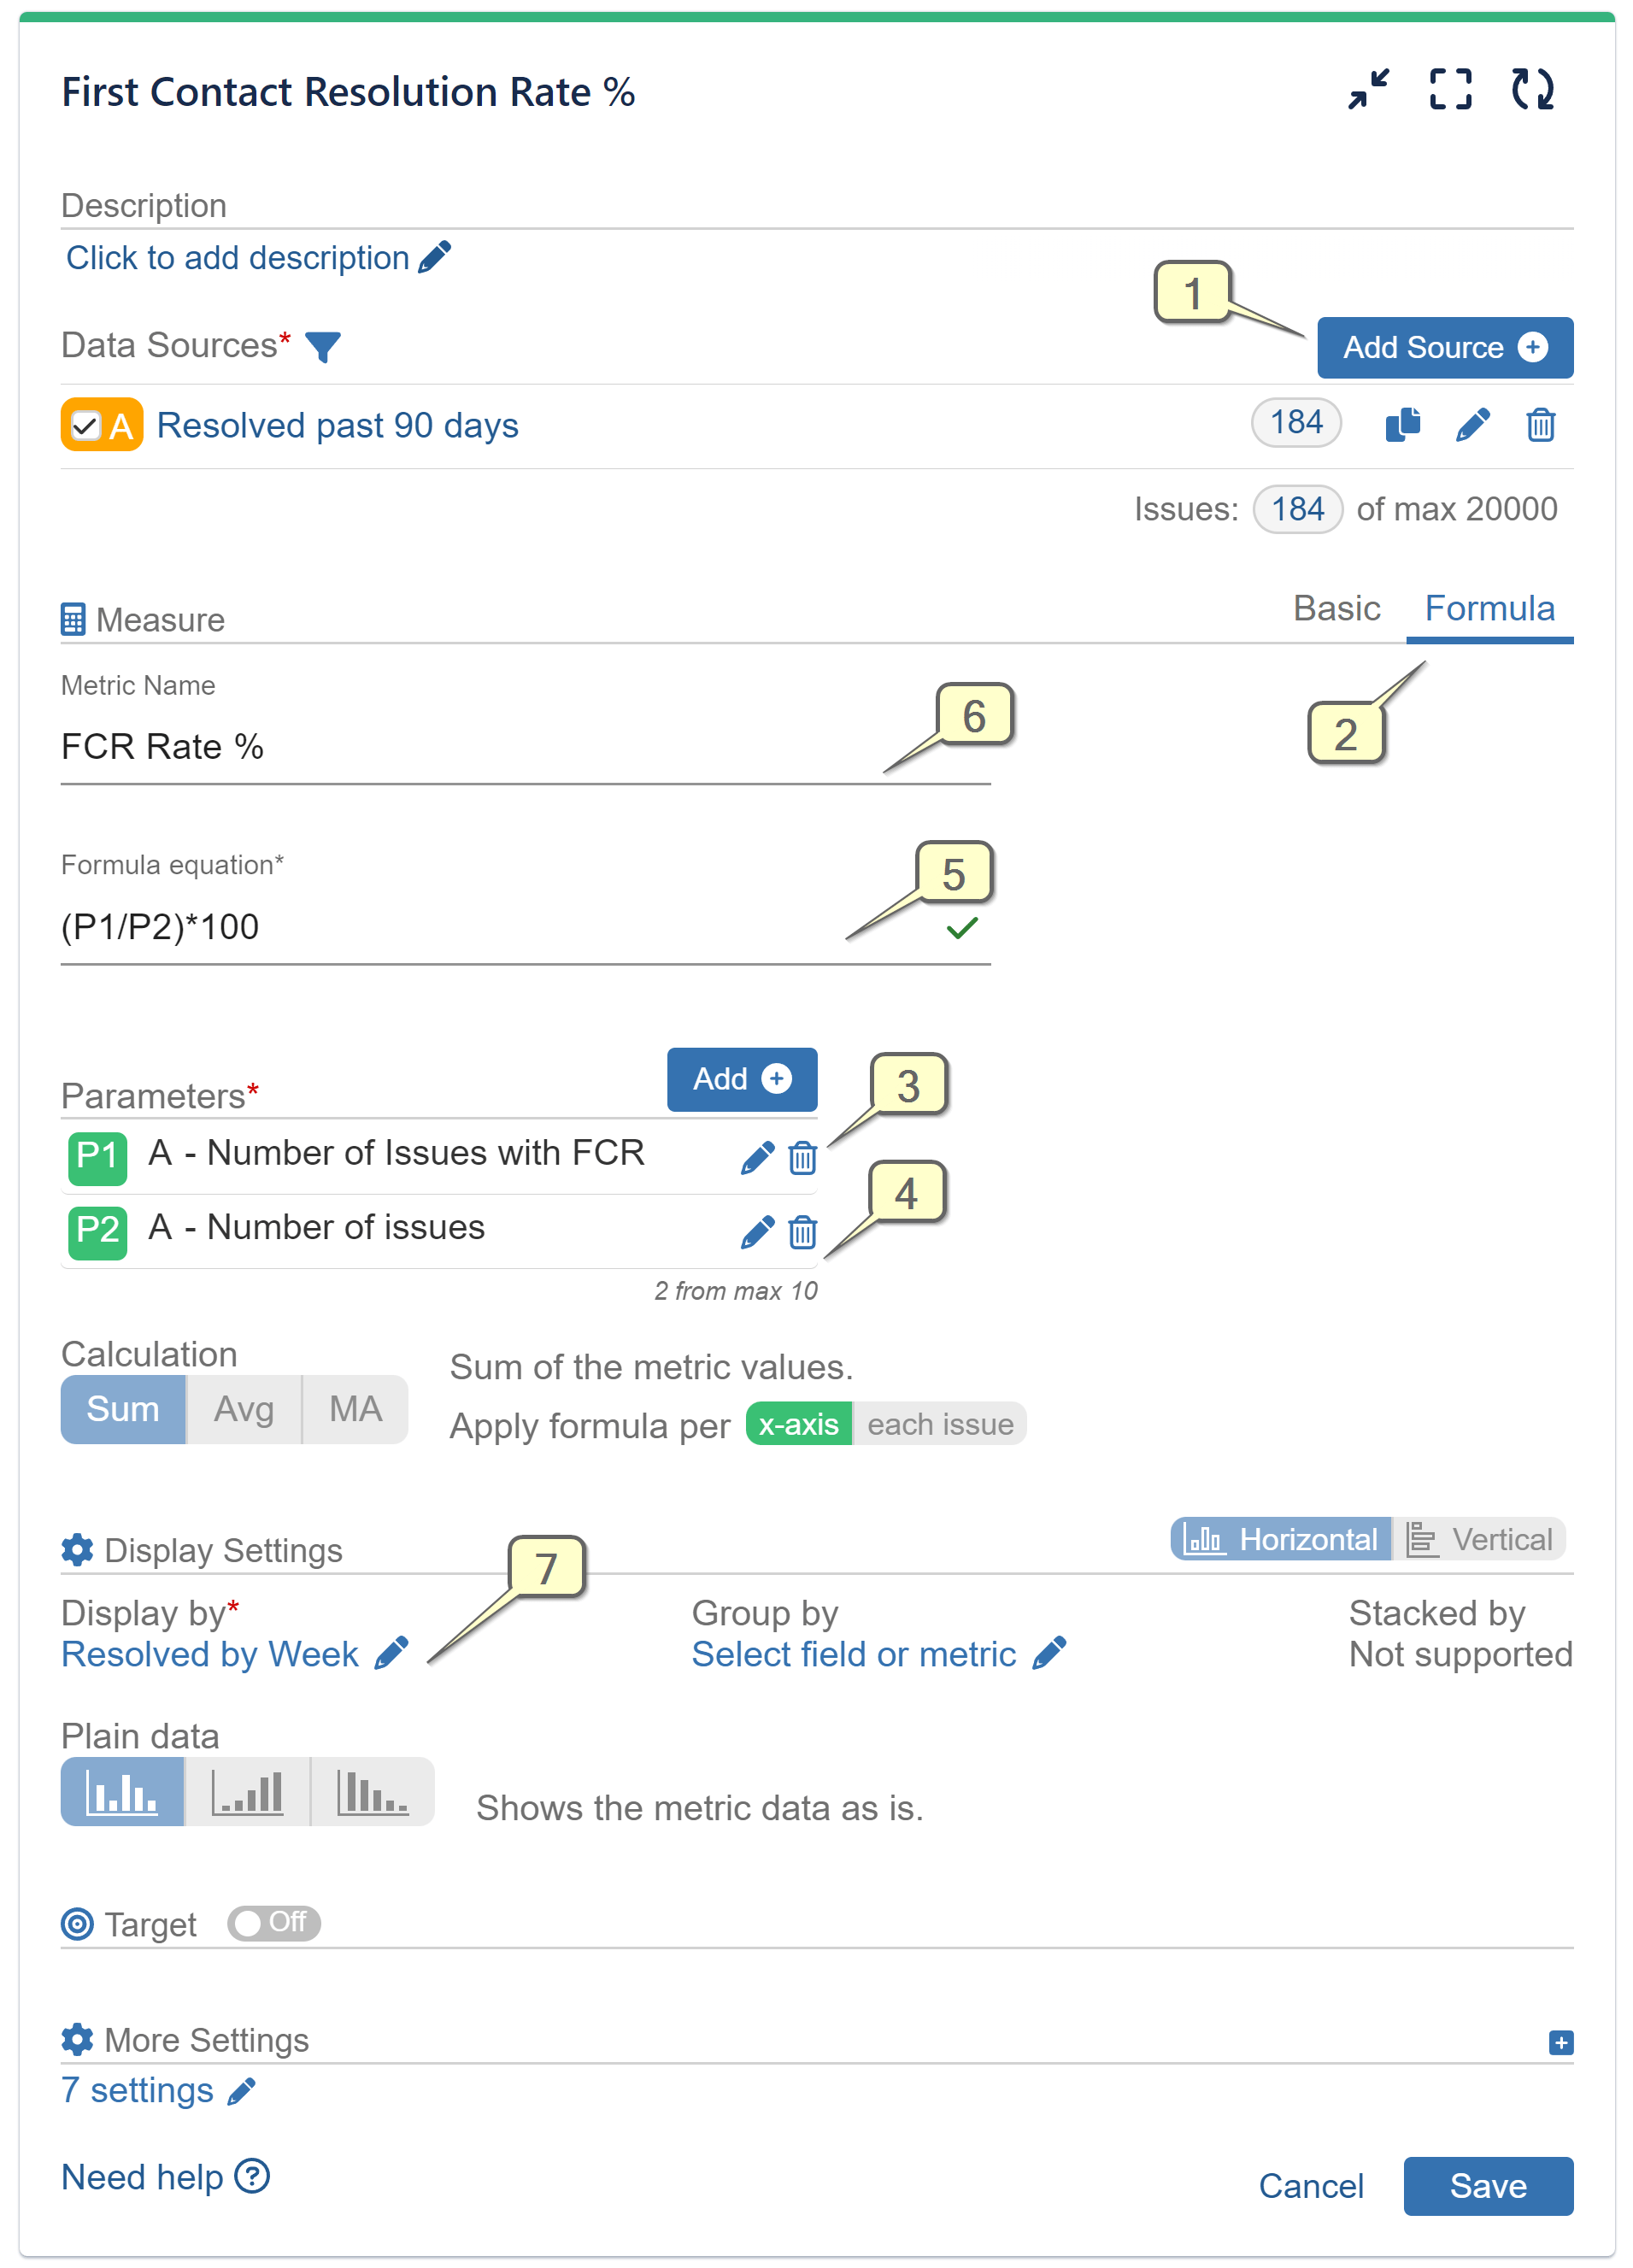
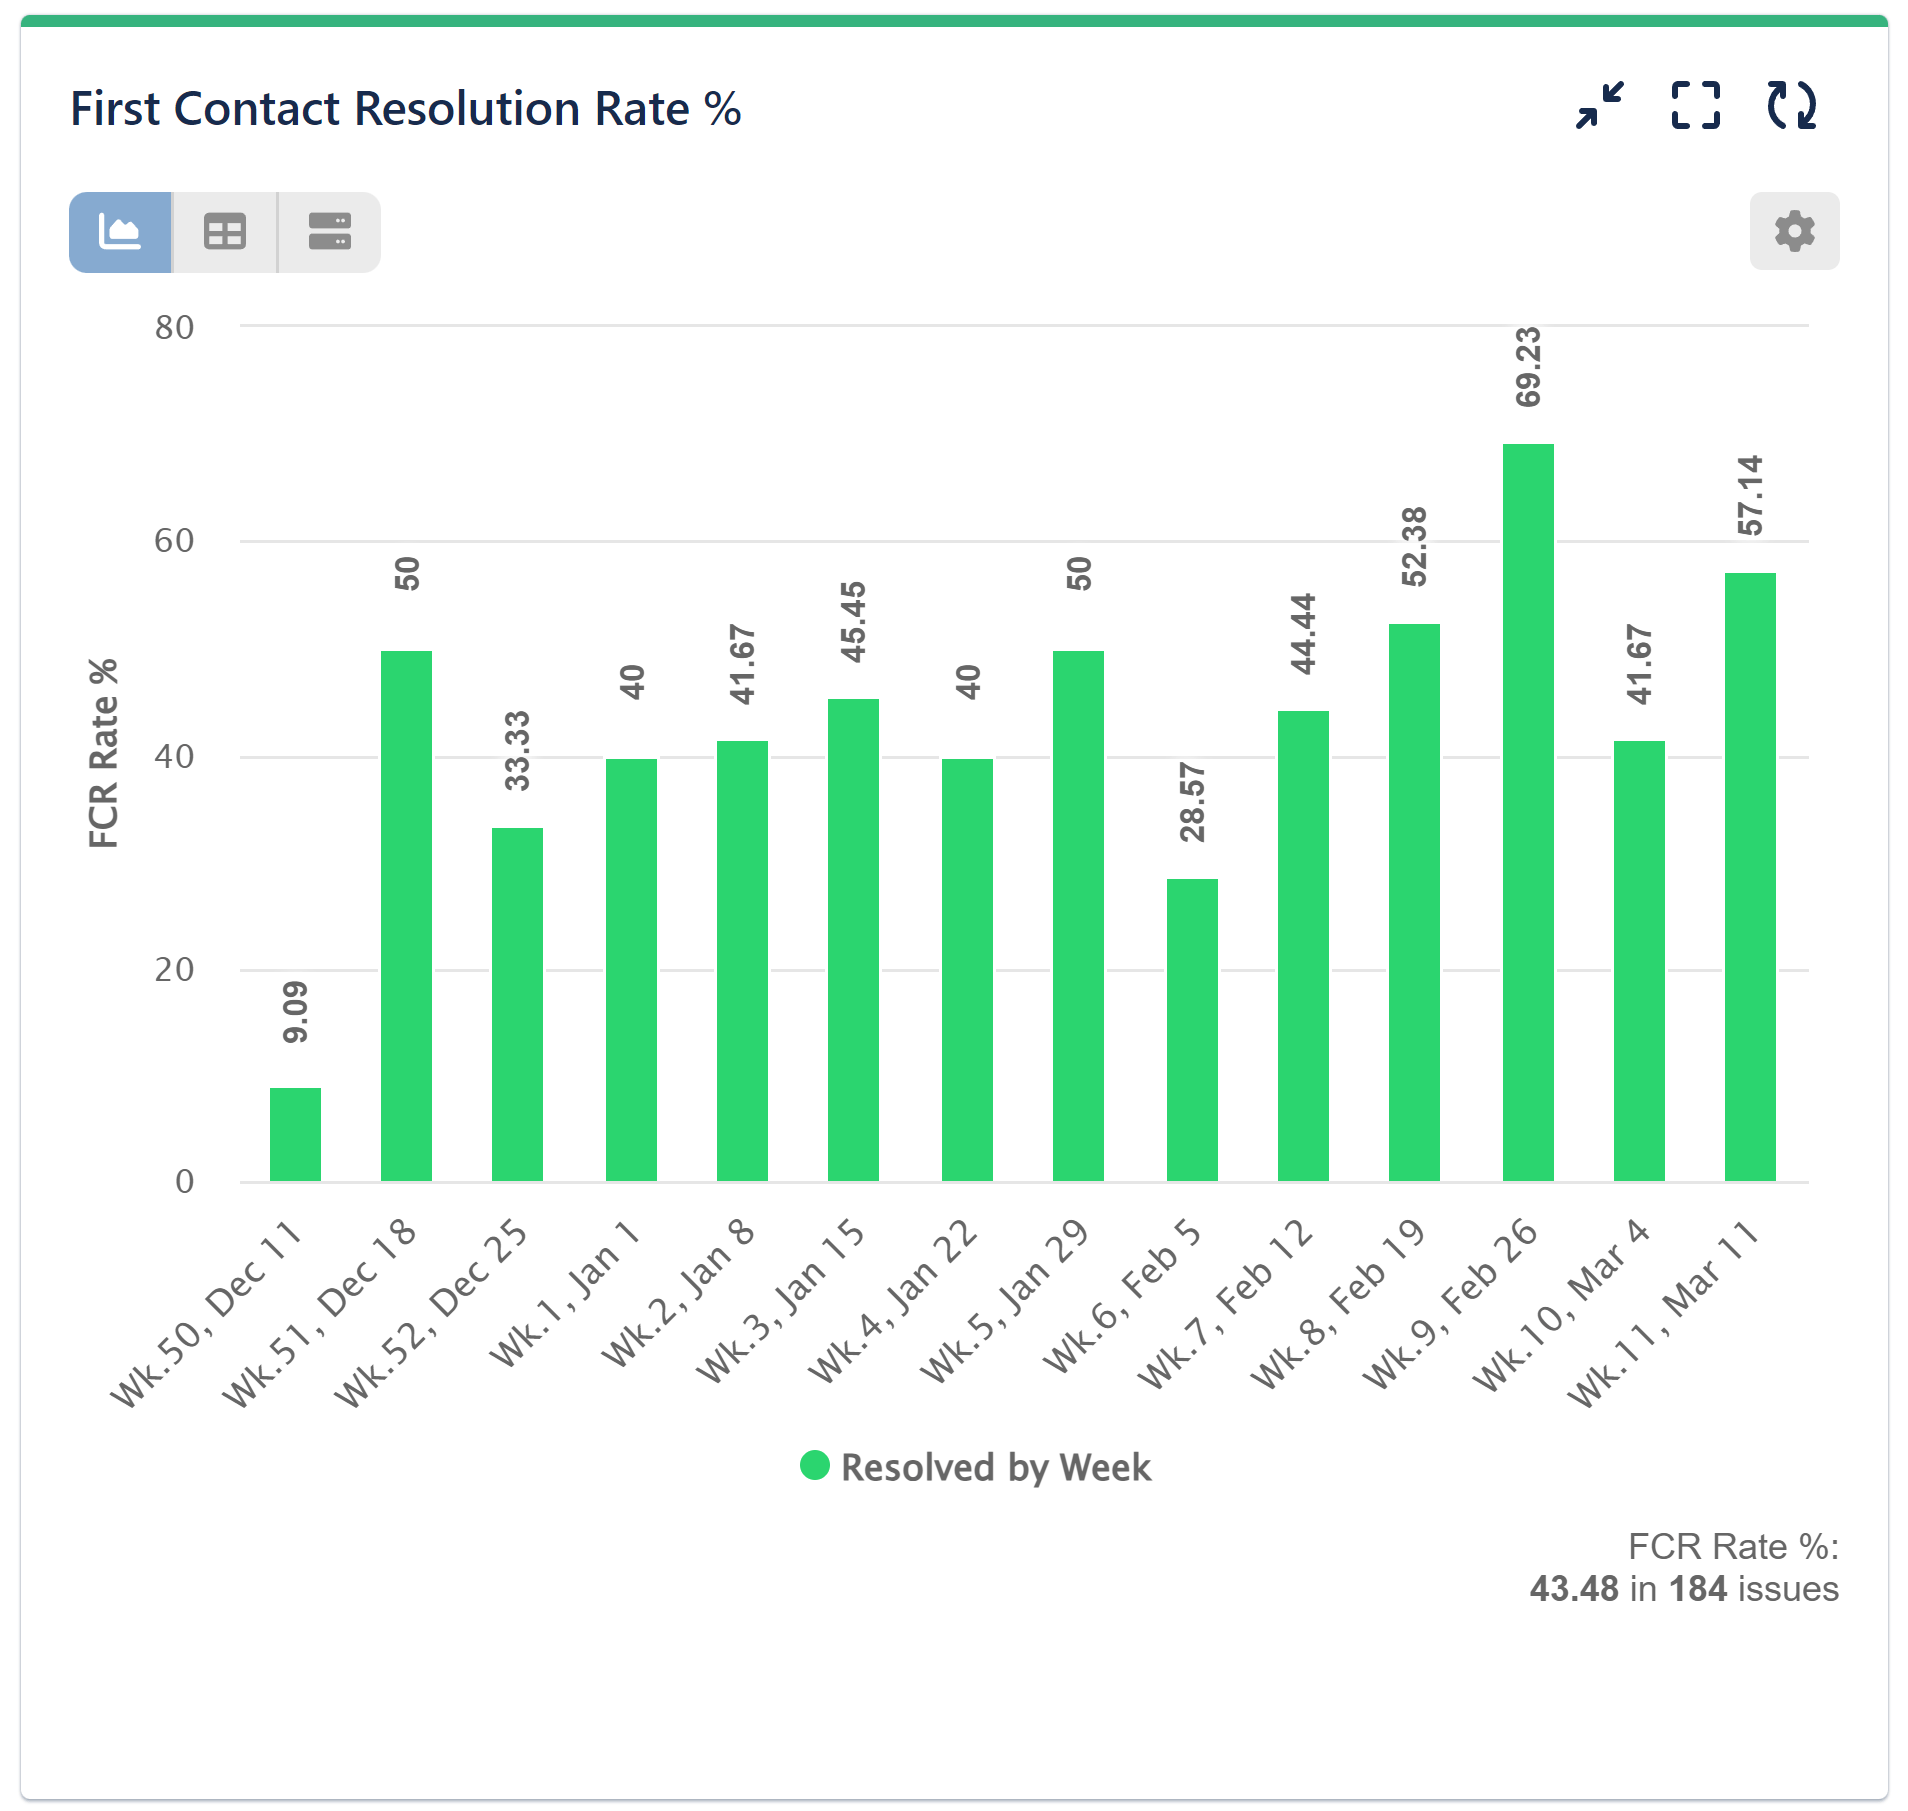
Step 1: Add Data Source.
Step 2: Navigate to the Formula Metric tab.
Step 3: From Formula settings navigate to Parameters. Then, include the Conditional ‘Cycles in status’ metric as Parameter 1, as shown on the image below:
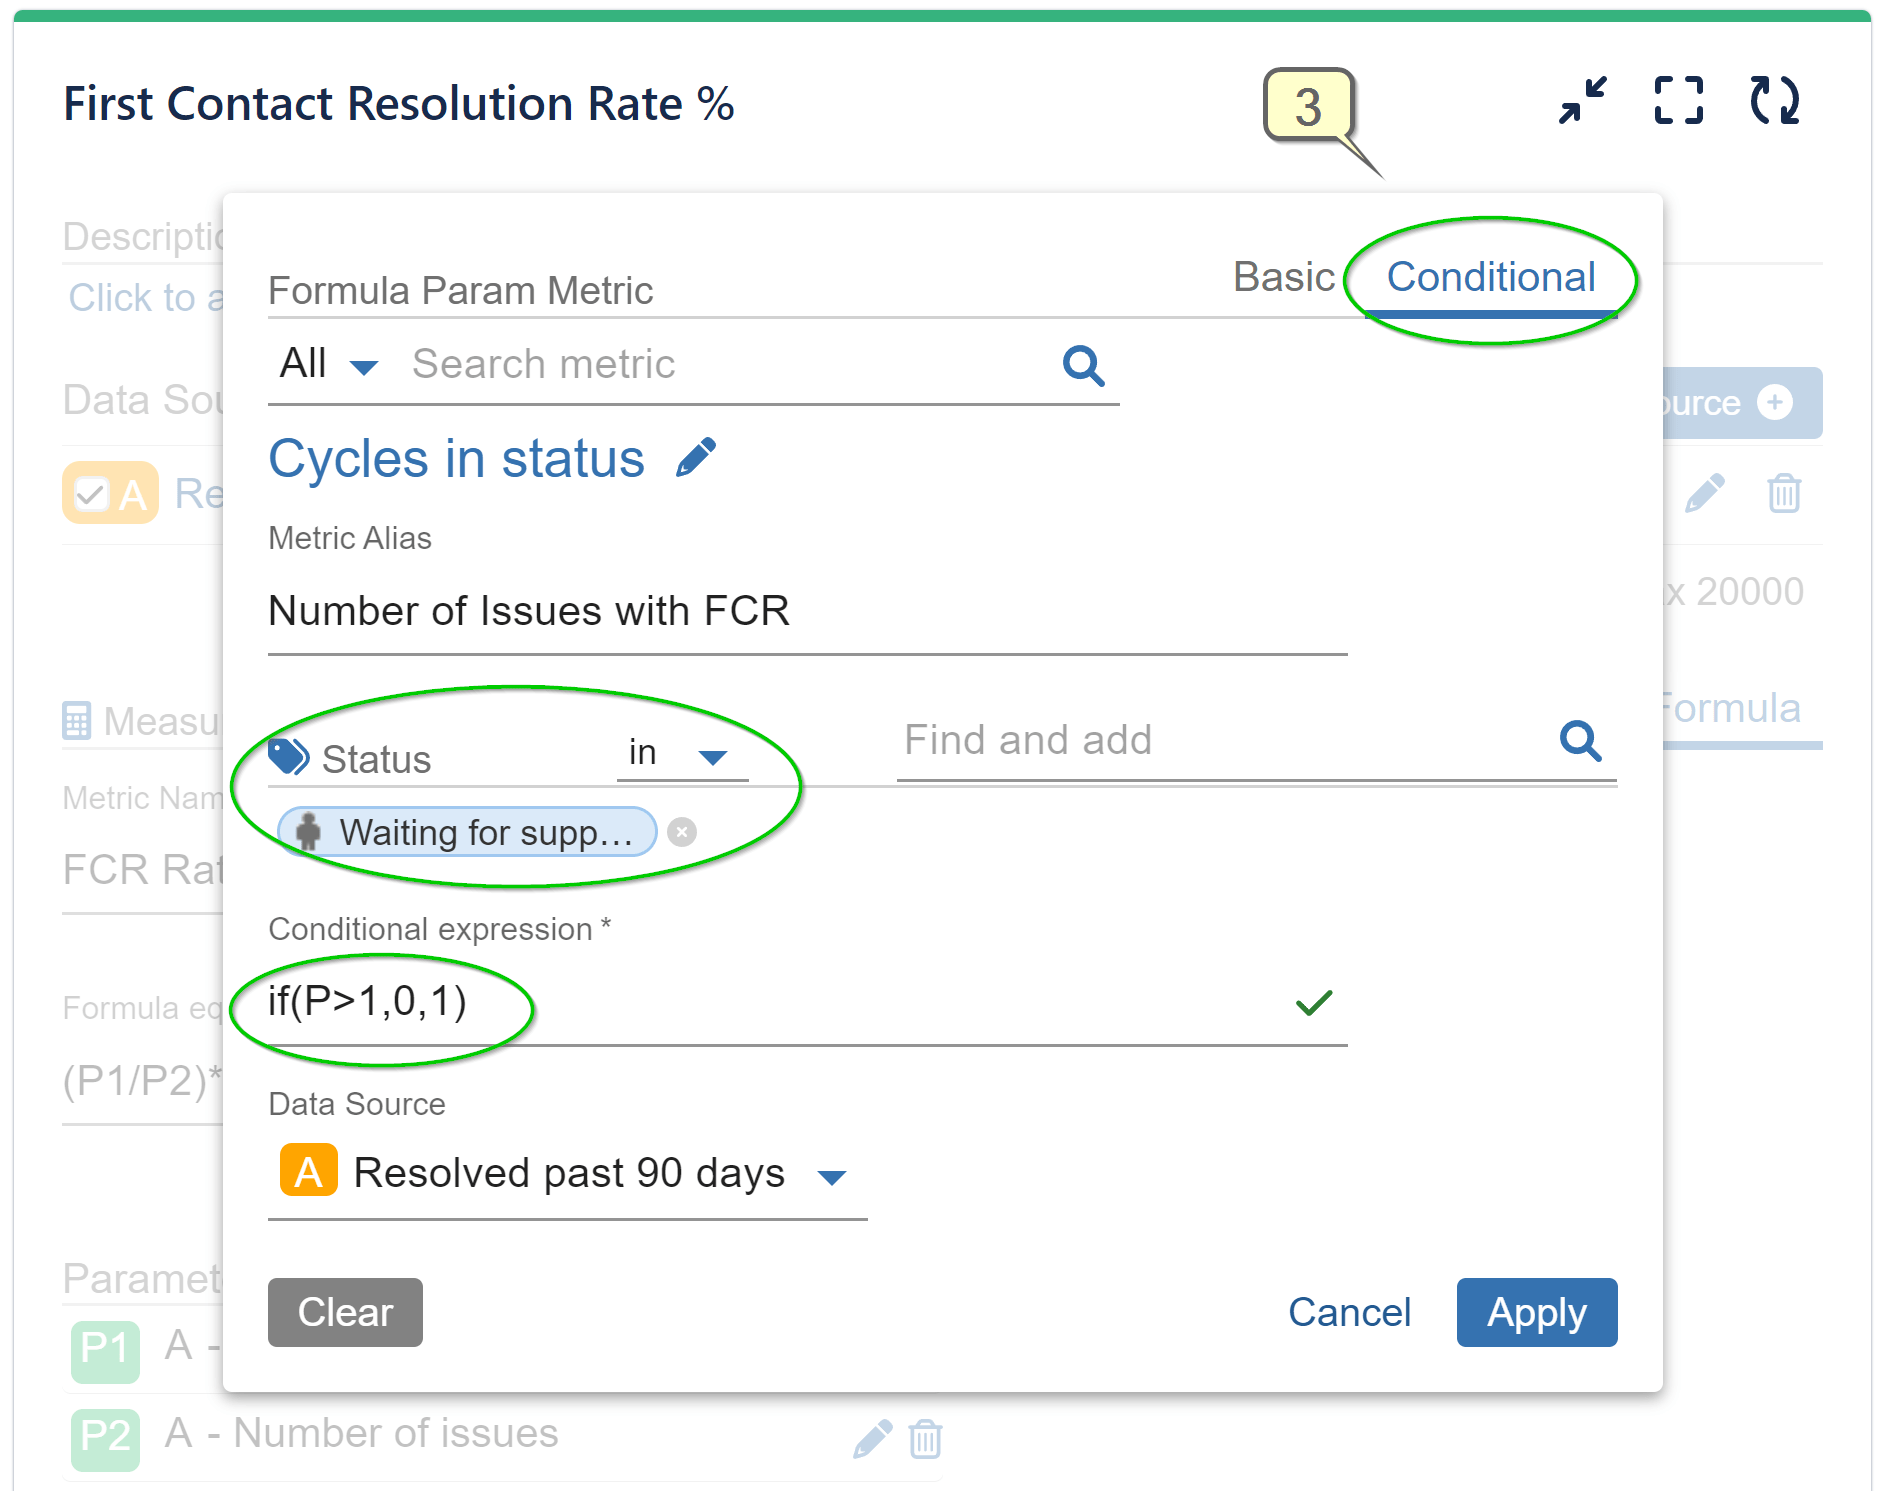
Step 4: Return to Formula settings screen to add the second parameter. Add Basic ‘Number of issues’ metric as Parameter 2, as displayed here:
Step 5: On the Formula settings screen type Formula Equation: (P1/P2)*100.
Step 6: Type Metric Name of your choice, e.g., “FCR Rate %”
Step 7: Select ‘Resolved by’ in the ‘Display by’ settings and choose your preferred date granularity. Save the configuration.
Set FCR KPI Targets for First Support Interaction Issue Resolution
Utilize the Target feature supported by Performance Objectives and Performance Trend gadgets to establish benchmarks and create FCR KPI reports. These reports can provide you with invaluable insights directly on your Jira dashboard, enabling data-driven decision-making. By aligning your teams with customer expectations and operational goals, you ensure optimal performance and enhanced customer satisfaction.
Please refer to the video recording for a step-by-step guide on creating a FCR KPI report with the following target: “50% of all issues resolved on the first support interaction.”
Compare ‘Number of FCR Issues’ to ‘Number of Issues’ using Multi Metric Combined Chart Gadget
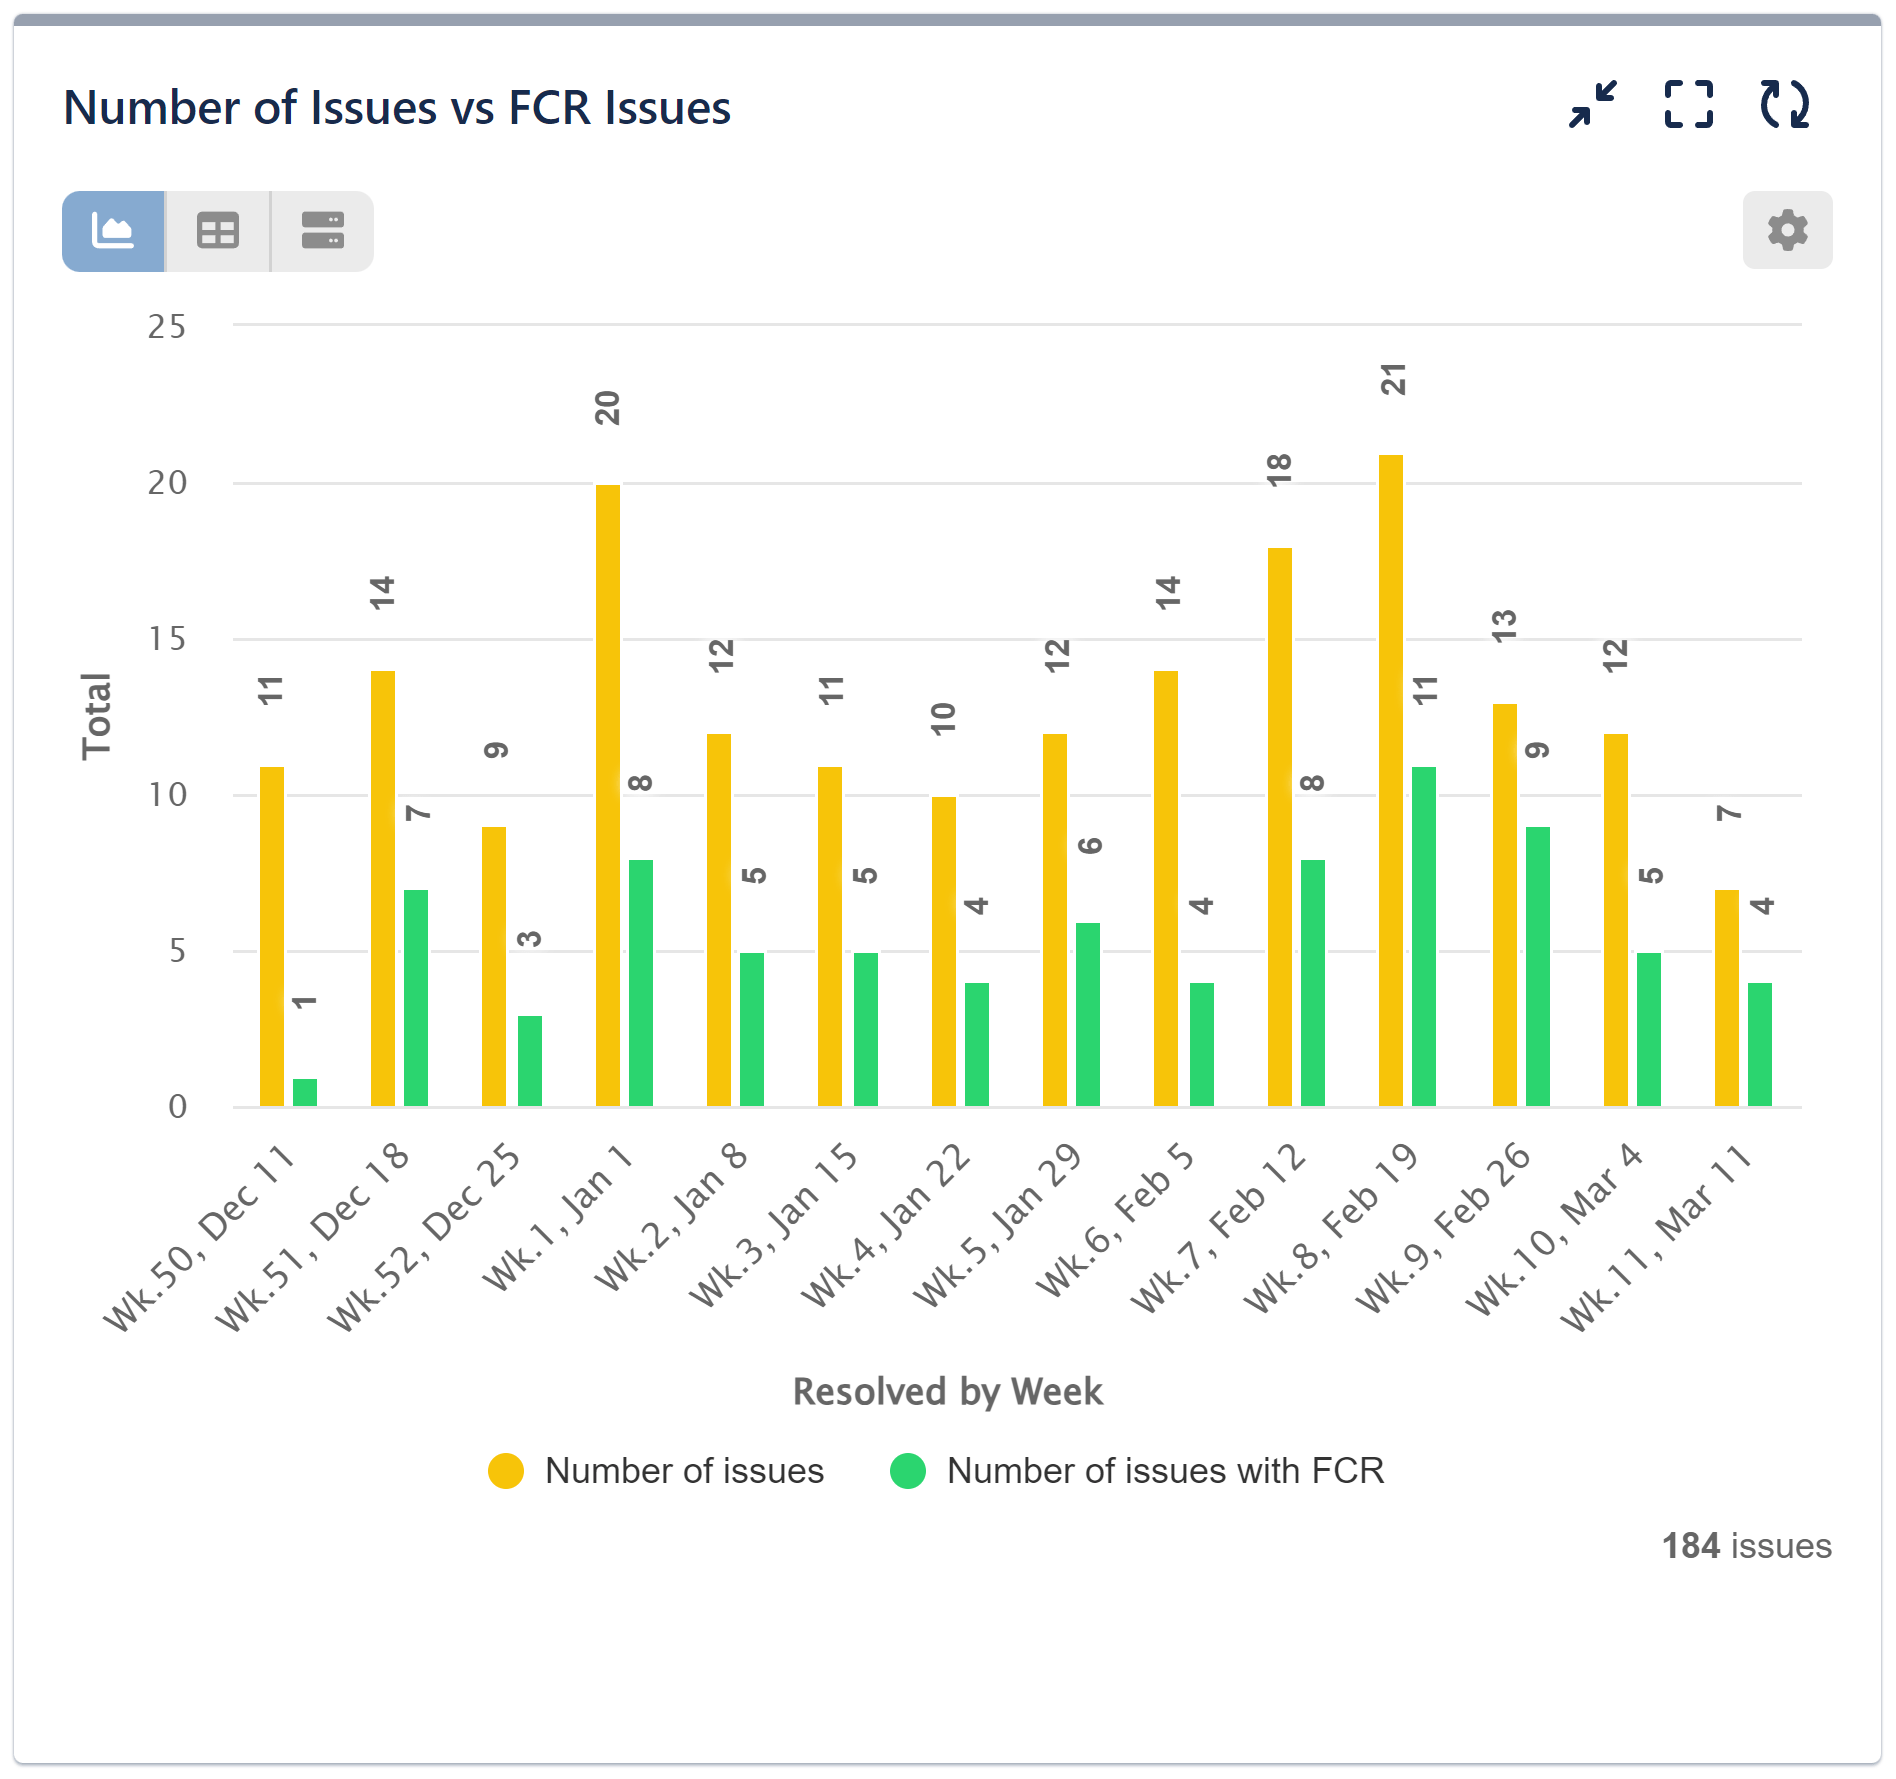
For those seeking a direct, side-by-side comparison between FCR Issues and All Issues right on their Jira dashboard, the Multi Metric Combined Chart Gadget provides an optimal solution:
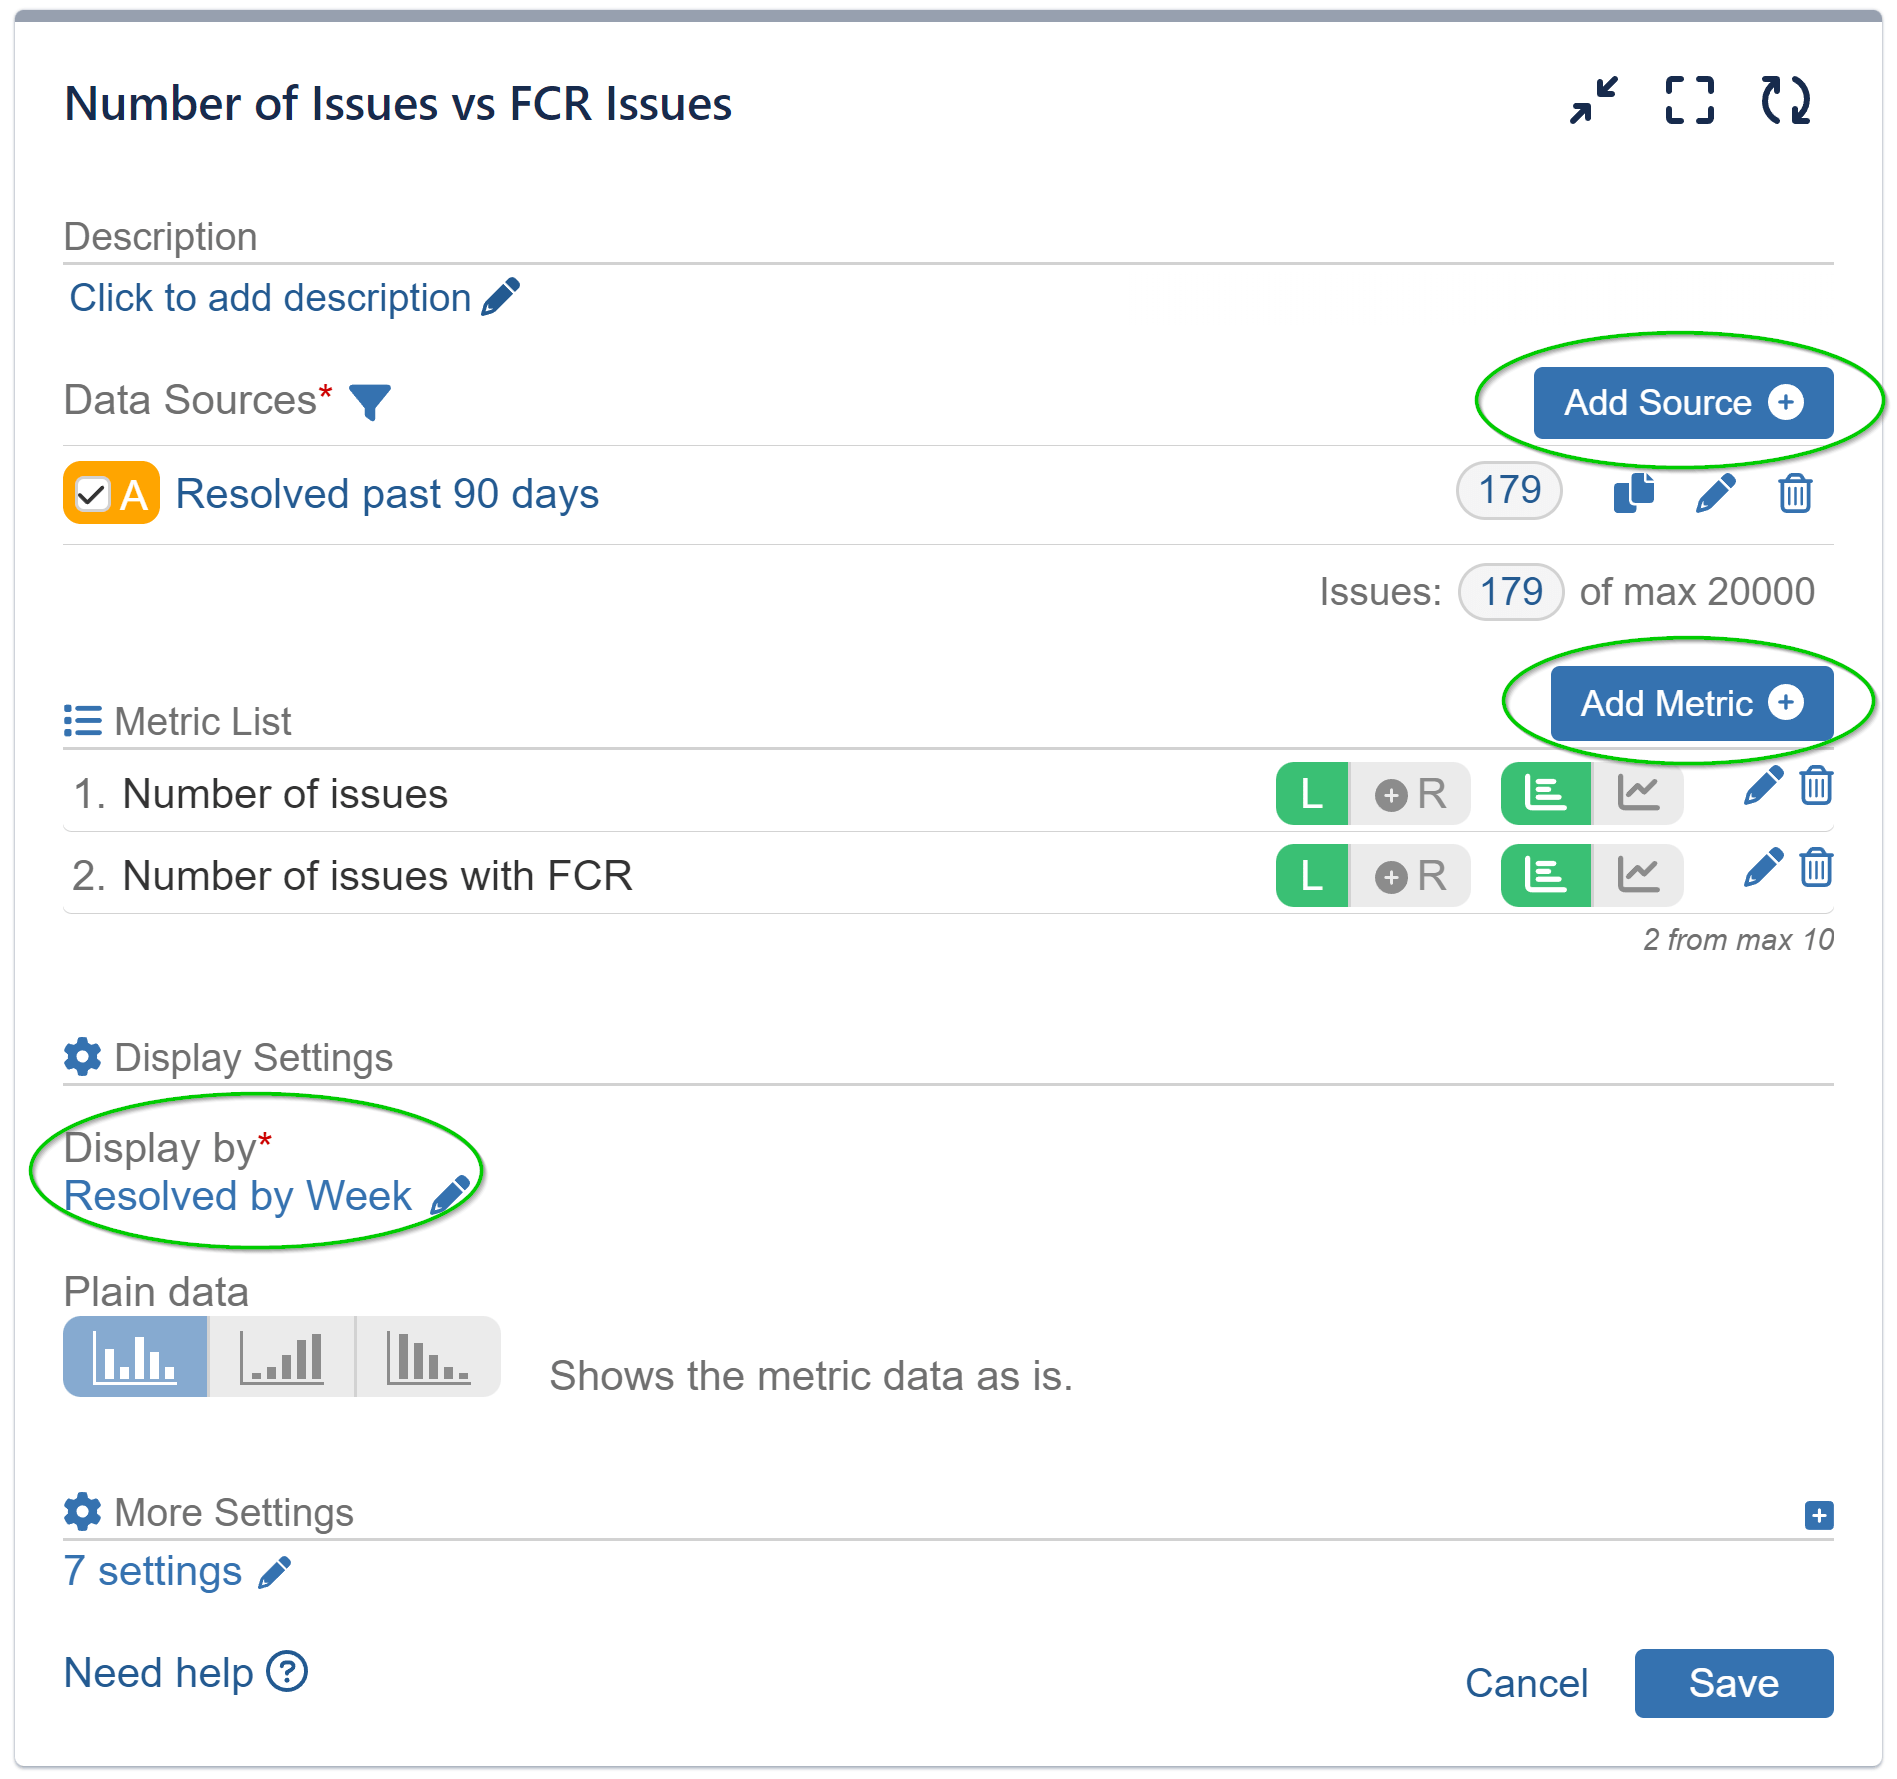
- Add Data Source
- Add ‘Cycles in status’ metrics with the same conditional expression used in our first use case as Metric 1.
- Add ‘Number of issues’ metric as Metric 2.
- Display by ‘Resolved’ issues and chose your preferred date granularity.
Here’s the configuration screen and visualization of this report:
First Contact Resolution is one of many useful metrics to track in Jira in order to support your team effectiveness and improve processes. Other Operations KPIs that may be of interest to you are SLA Breach Report per team/assignee, Mean Time to Resolution, First Response Time.
These and many more custom reports are easily achievable with Performance Objectives: Charts for Jira app.
Start your 30 days free trial of Performance Objectives: Charts for Jira from Atlassian Marketplace.