Table of Contents
In the realm of Quality Assurance (QA) and software development, ensuring timely and accurate reporting of defects is pivotal for maintaining customer satisfaction and optimizing the overall development process. This article delves into the creation of a comprehensive Punctuality of Reported Defects report in Jira, highlighting the integration of the Performance Objectives app to enhance QA practices, streamline reporting procedures, and ultimately elevate customer satisfaction.
To optimize the process of defect identification and reporting, it’s essential to set clear performance objectives. The primary goal is to minimize the occurrence of false-positive cases reported by the QA team, which can lead to unnecessary delays and resource waste. One way to do this is by getting better at finding and describing repeatable patterns. Performance Objectives and Performance Trend gadgets support Target calculation feature, making it easy to establish clear, real-time, and measurable goals for your QA team directly within your Jira dashboard.
Setting the Performance Objective to Address False Positives
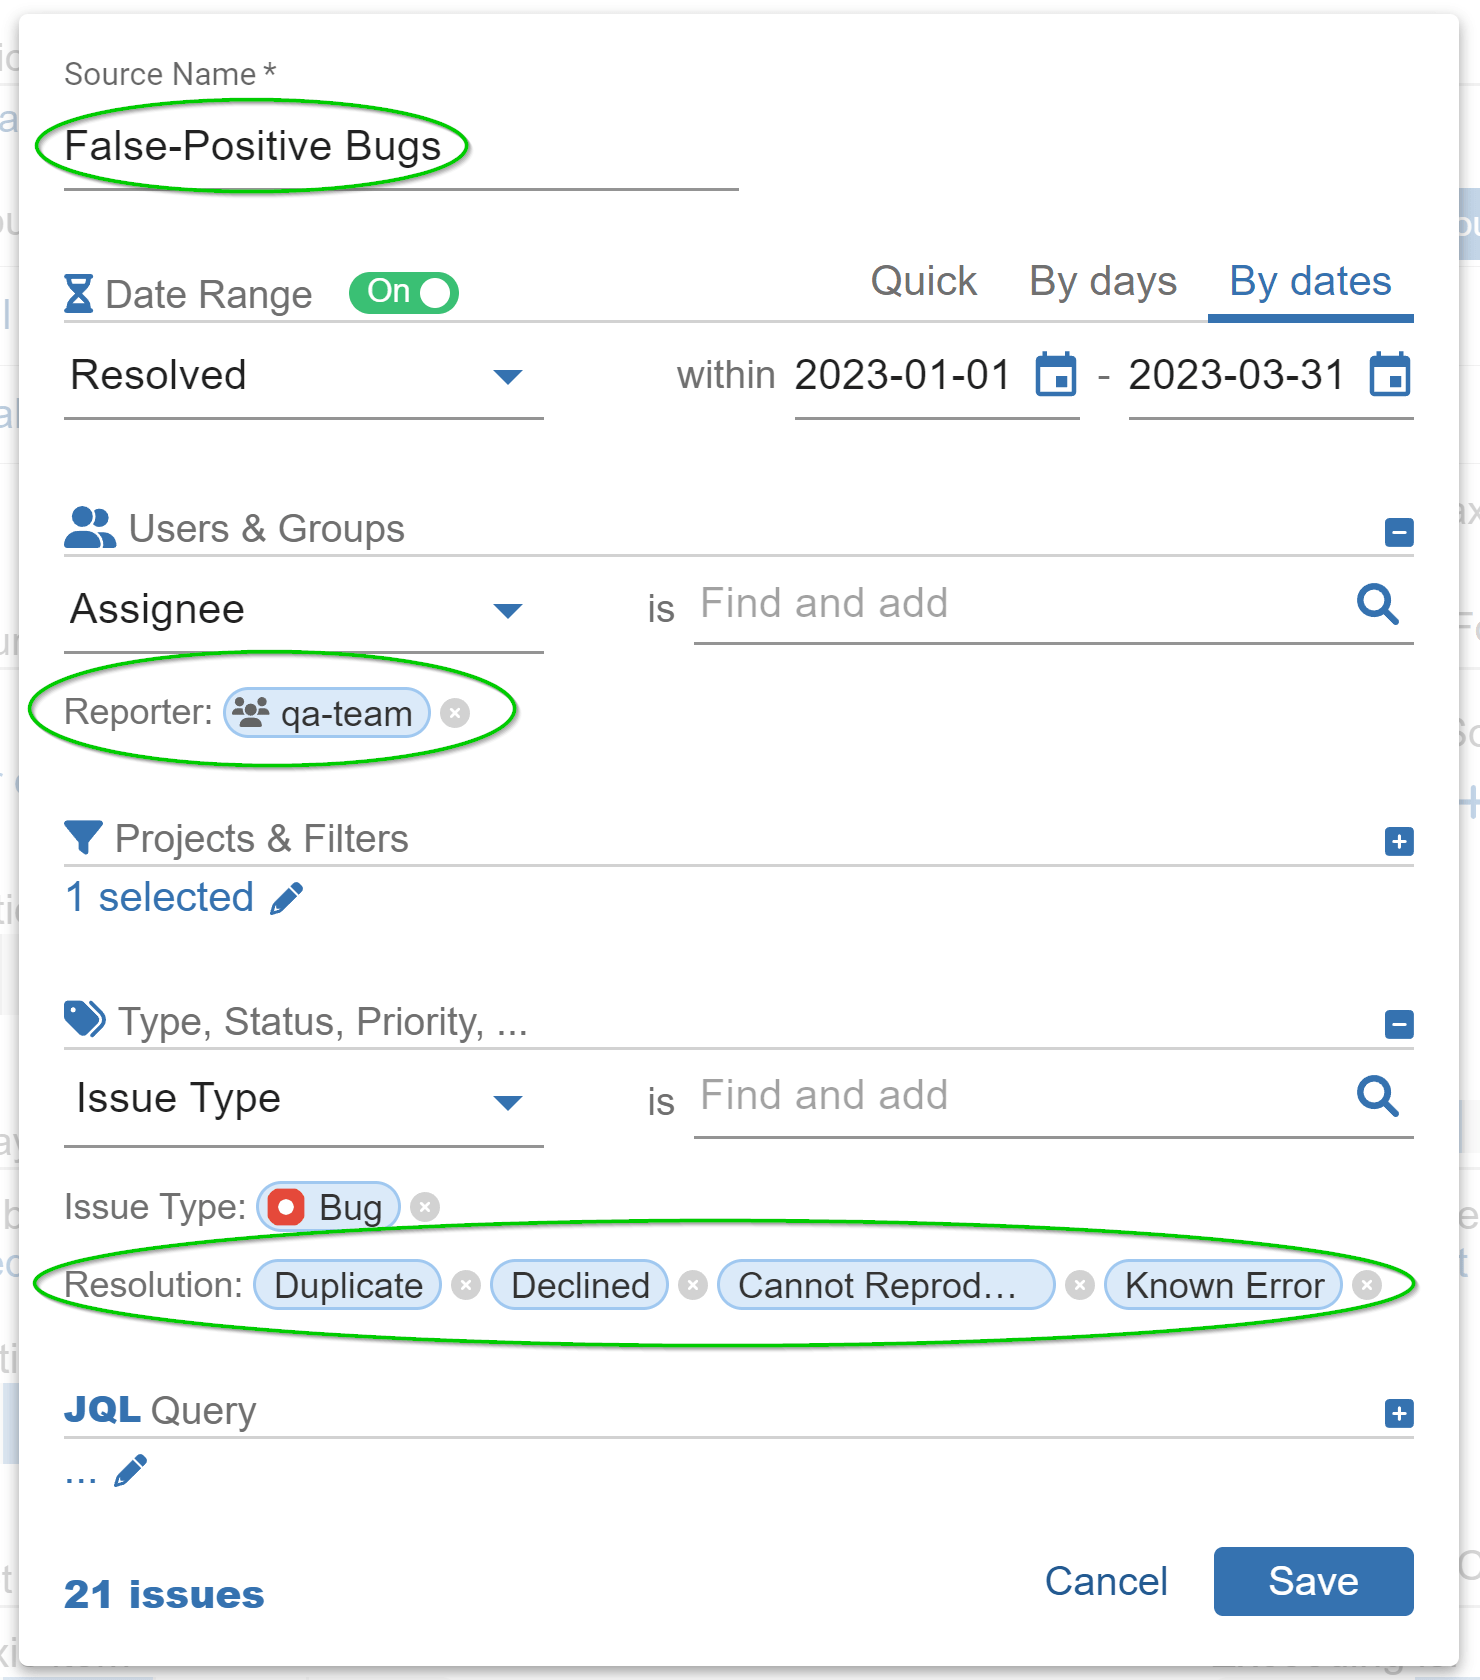
The objective for this initiative can be defined as follows: “Ensure that a maximum of 5% of the total bugs reported by the QA team are categorized as false positives.” This entails actively addressing issues marked with resolutions such as ‘Not a Defect,’ ‘Duplicate,’ ‘Cannot Reproduce,’ or similar. By adhering to this goal, the development team aims to significantly enhance the accuracy and punctuality of reported defects.
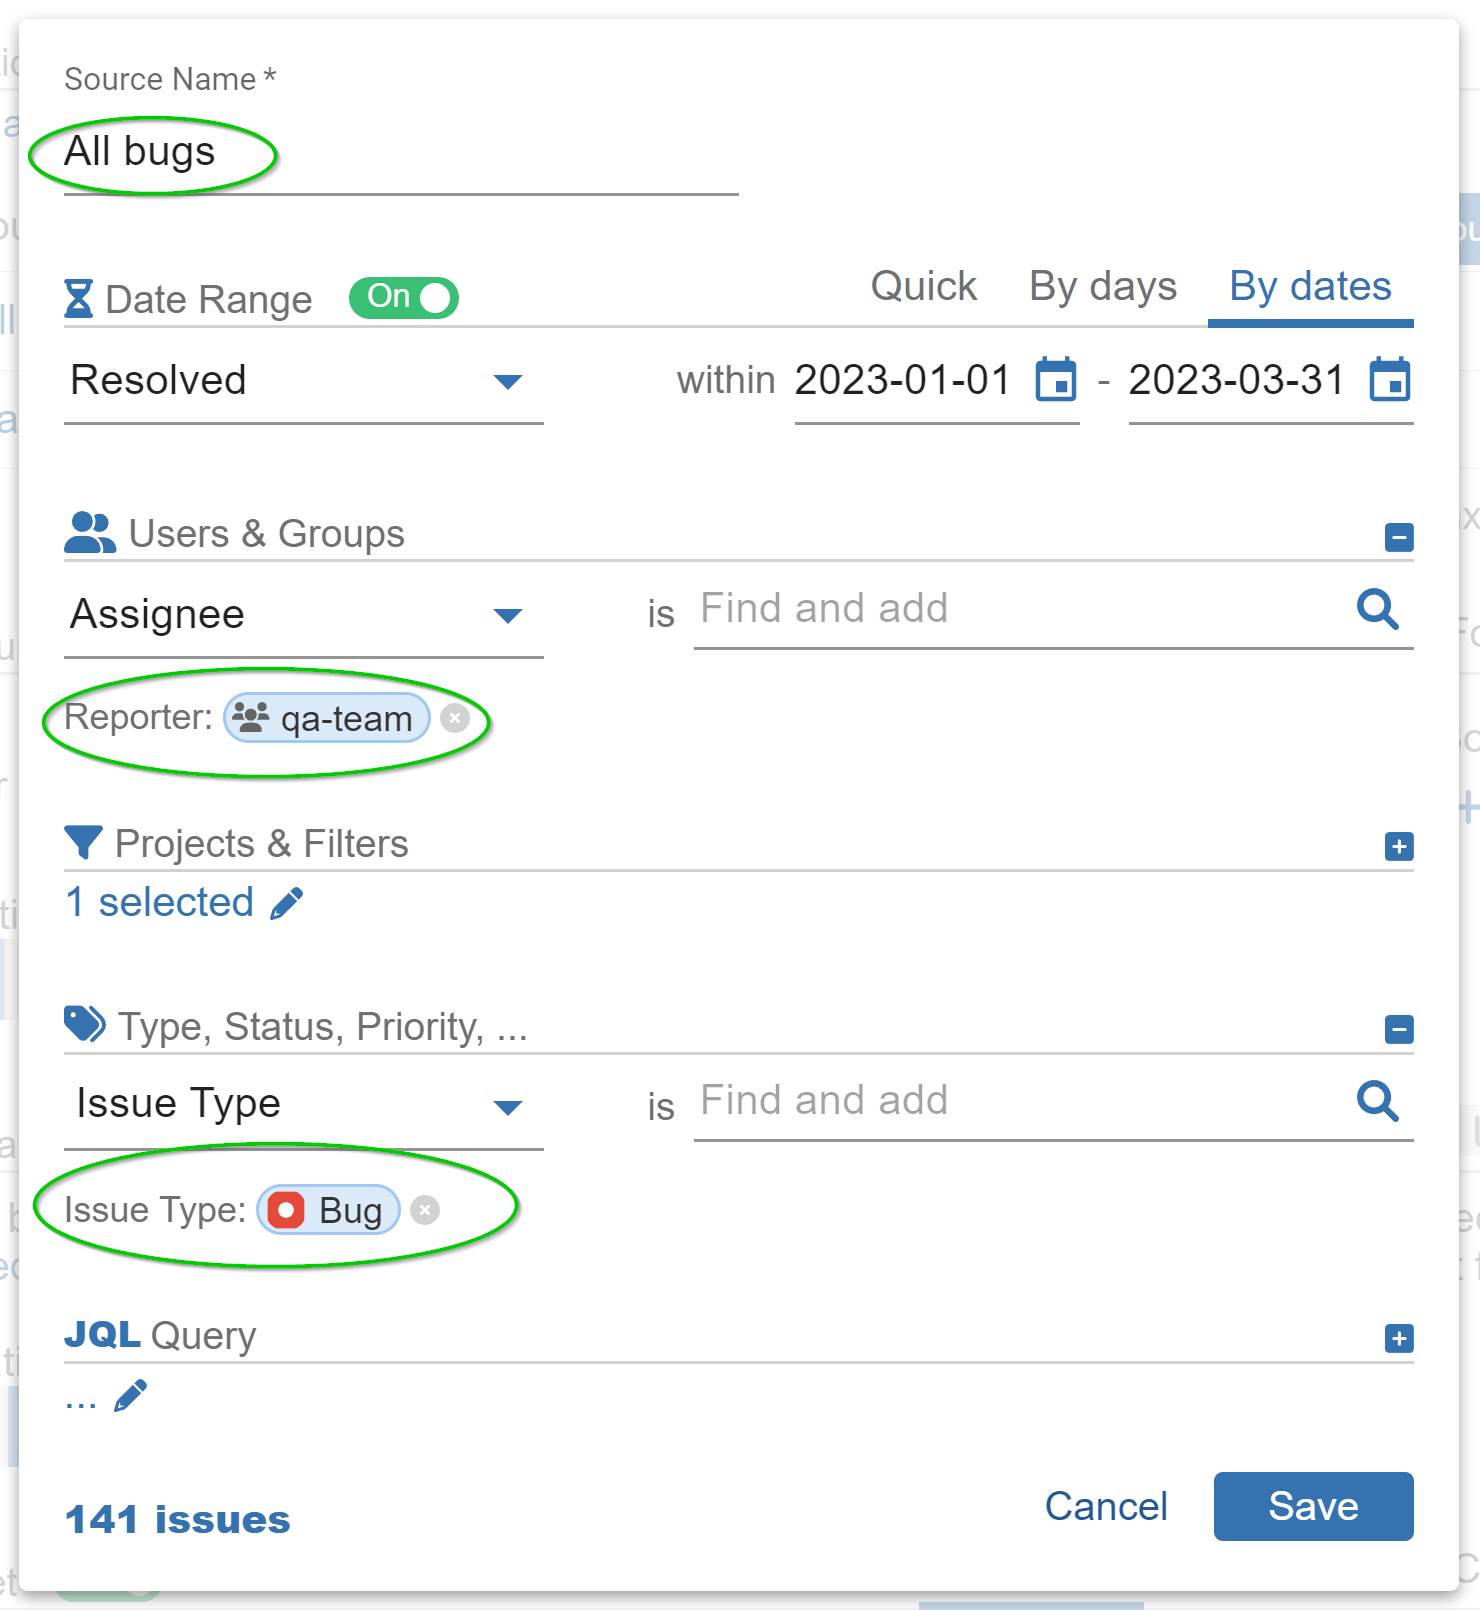
Here’s how the rich data segmentation feature of the Performance Objectives: Charts for Jira app can be used to effectively filter issues with the appropriate resolution for creating such a report. Below are the two data sources created to filter out the issues for our Punctuality of reported defects report:
Data Source 1 – All Bugs:

Data Source 2 – False-Positive Bugs:

Create Punctuality of Reported Defects Report in Jira
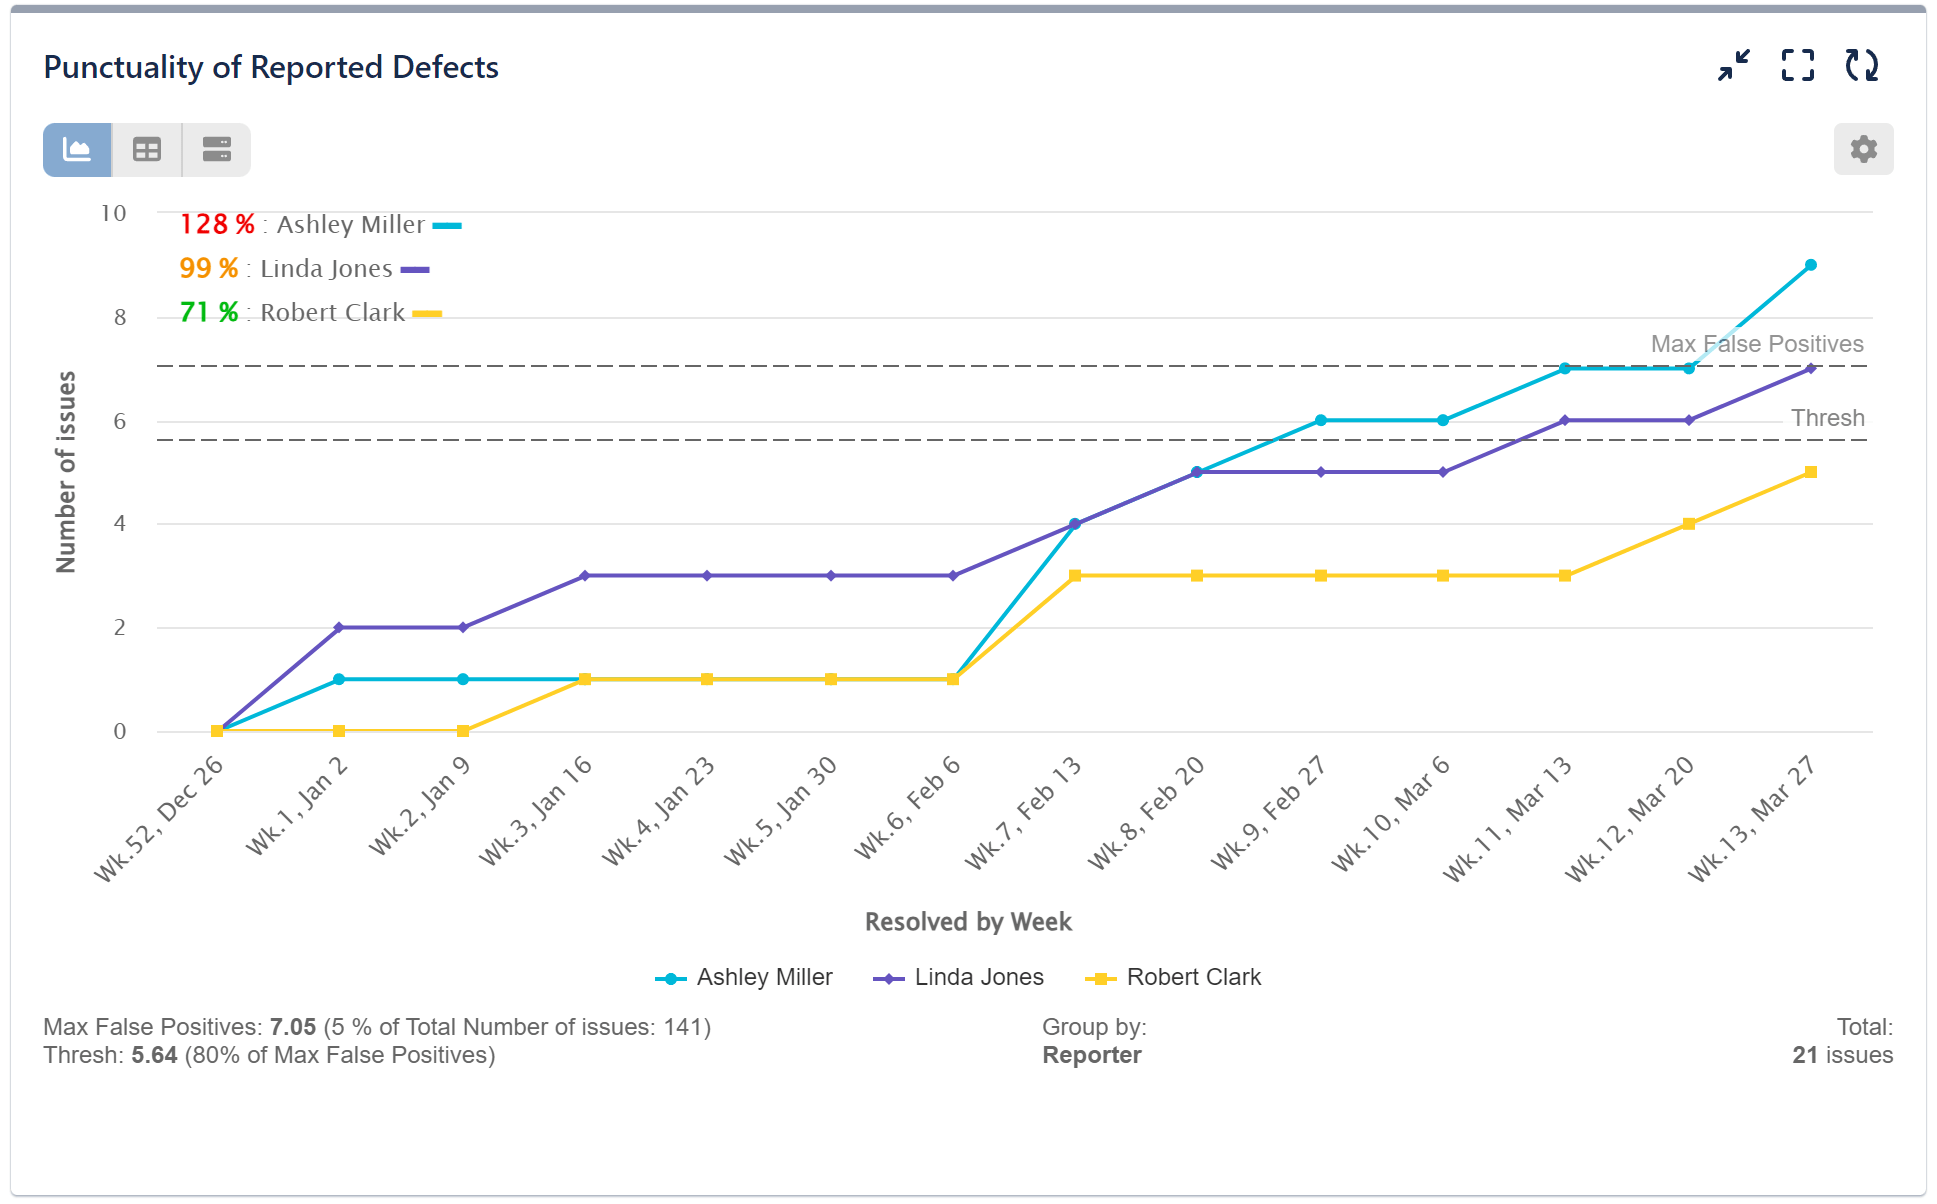
Let’s now generate a sample QA KPI report within Jira, focusing on the total number of reported false positive bugs by the QA team over a specific timeframe. In this instance, we will use the Performance Trend gadget, although a comparable report can also be created using the Performance Objectives gadget.

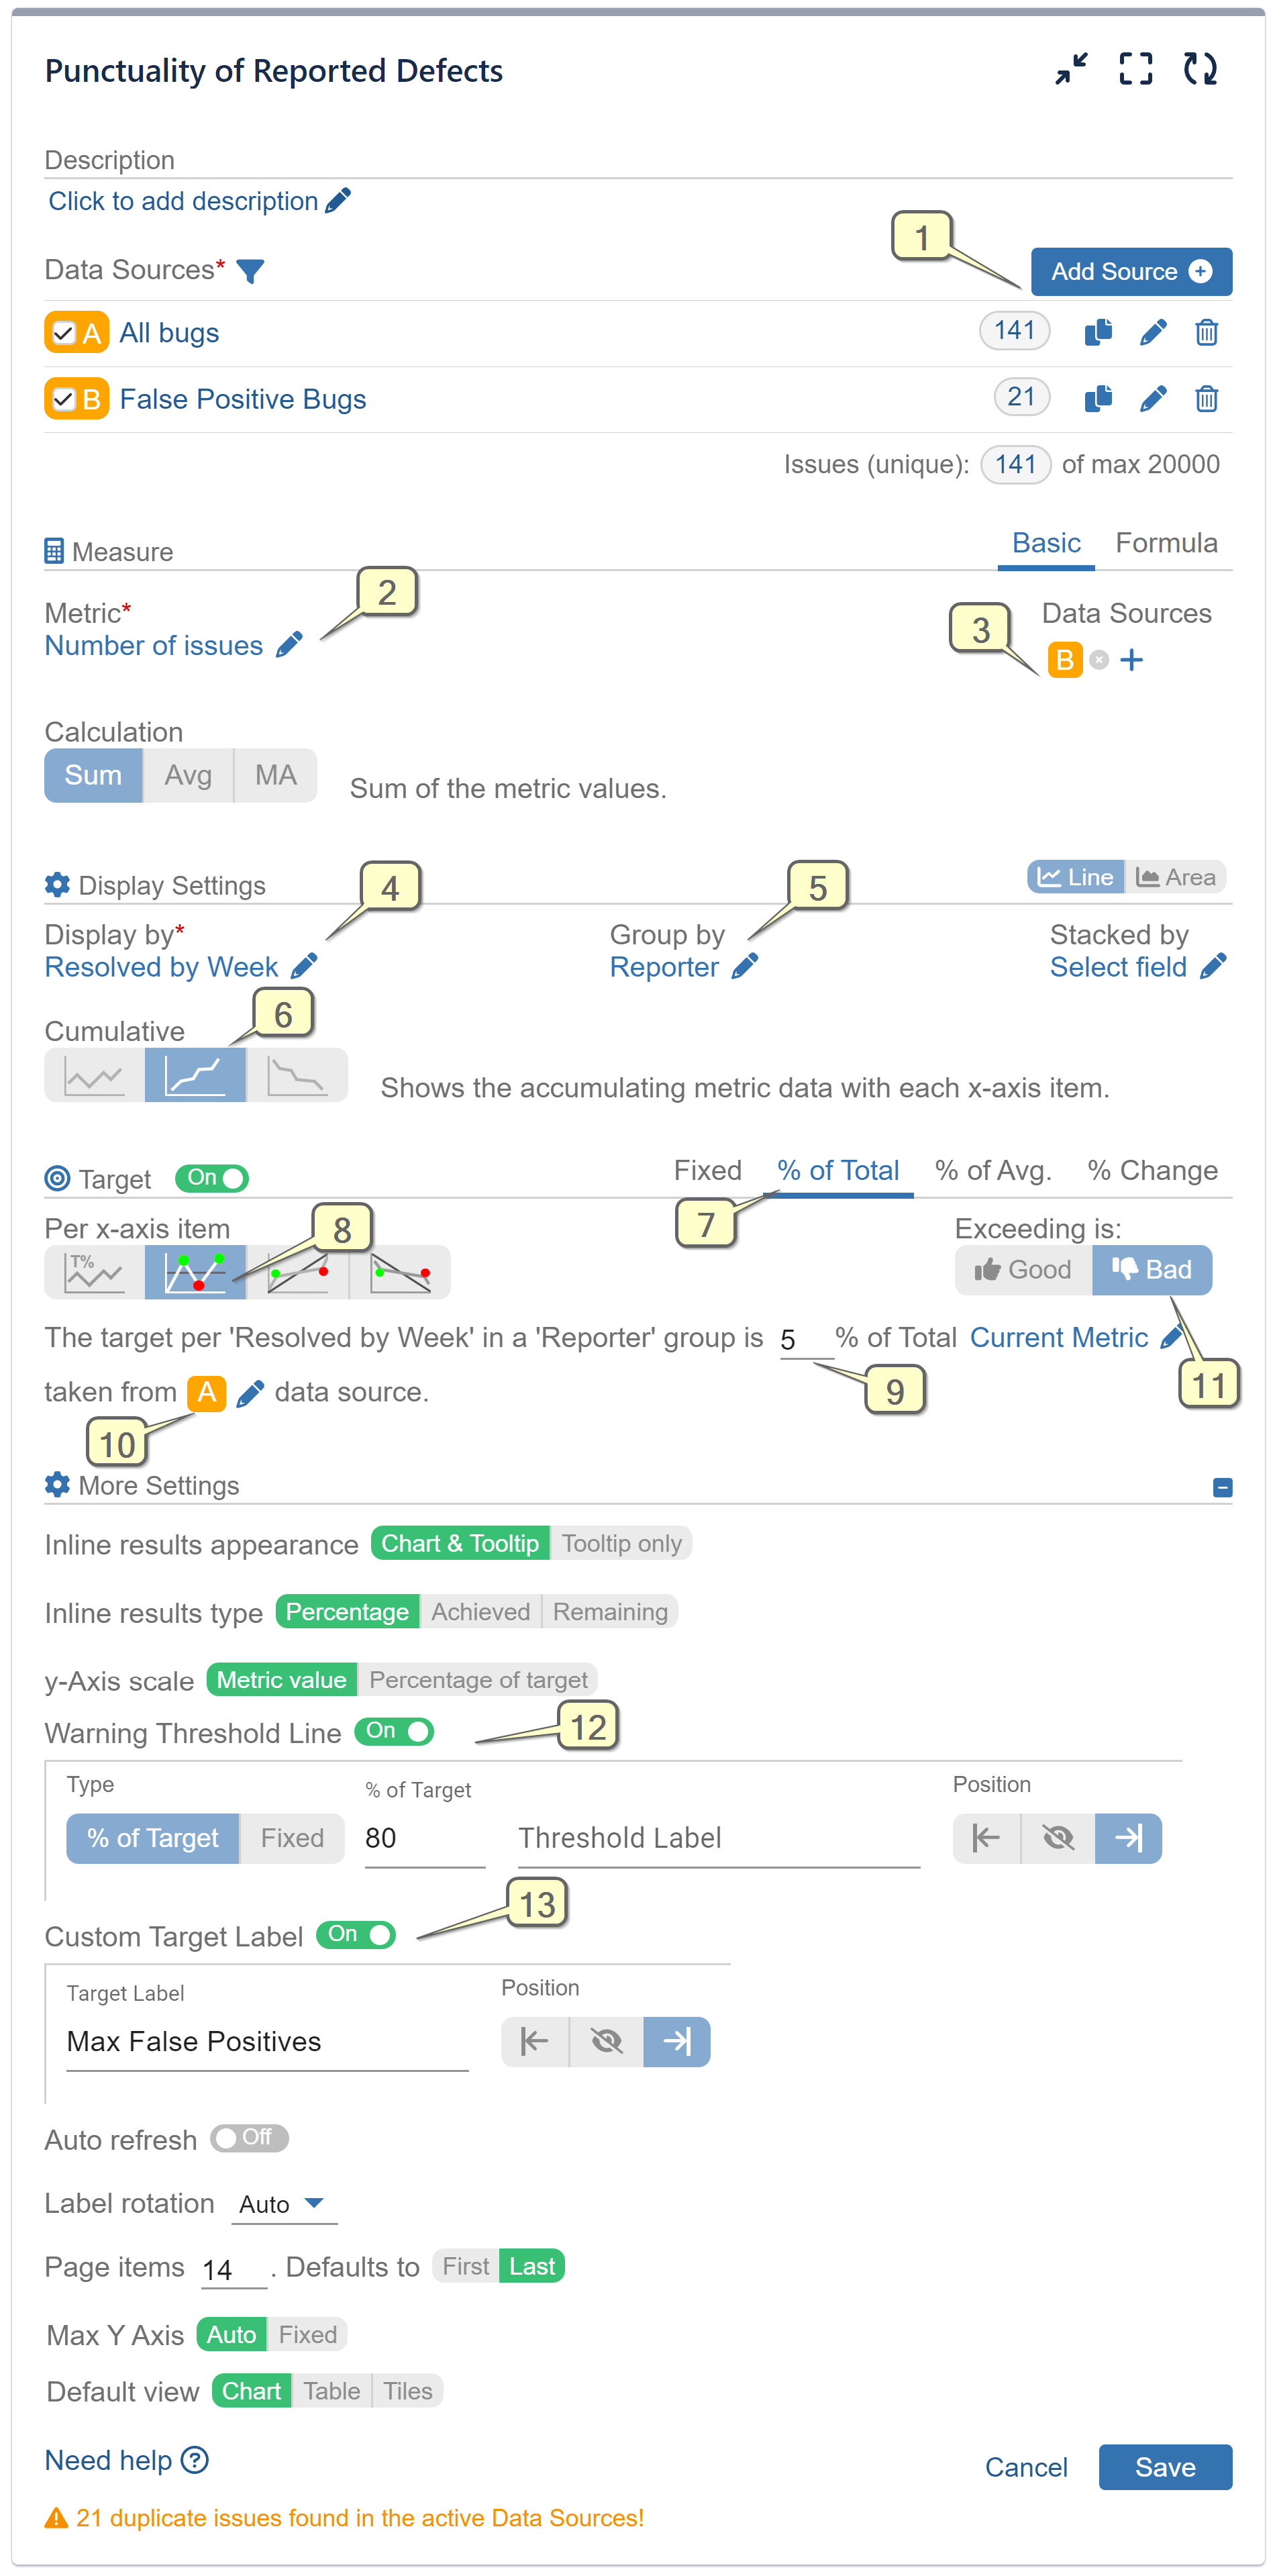
Below is a comprehensive, step-by-step guide showing the configuration process for generating a Punctuality of Reported Defects report in Jira using our app:
Step 1: Begin by adding two distinct Data Sources, labeled as ‘All Bugs’ and ‘False-Positive Bugs.’ Ensure that the ‘False-Positive Bugs’ Data Source is configured to display only issues with the appropriate Resolution, as demonstrated above in the data segmentation screens.
Step 2: Proceed to select the ‘Number of Issues’ metric.
Step 3: Opt for Data Source ‘B’ (named False Positive Bugs) for the ‘Number of Issues’ metric.
Step 4: Choose ‘Resolved by Week’ for Display by.
Step 5: Choose ‘Reporter’ for Group by, to group the data by the individuals who raised the Jira issues.
Step 6: Employ the ‘Cumulative’ mode, allowing the data to accumulate with each passing week.
Step 7: Activate the Target feature and choose the ‘% of Total’ target type.
Step 8: Select the ‘Per x-axis item’ results presentation, allowing you to track the KPI’s progression towards the predefined target.
Step 9: Set the max acceptable false positive rate per reporter to ‘5%’.
Step 10: For target value calculation, choose Data Source ‘A’ – ‘All bugs’.
Step 11: Toggle the ‘Exceeding is’ option to ‘Bad,’ signifying whether the objective is positive or negative. If the target is surpassed, the outcomes will be highlighted in red.
Step 12: (Optional) In the ‘More Settings’ section, activate and set the ‘Warning Threshold’.
Step 13: (Optional) Activate the ‘Custom Target Label’ and assign a label indicating that the target is negative. This communicates that exceeding the target is deemed a failed objective.

Video recording for QA KPI report in Jira
Incorporating the Performance Objectives app into the bug reporting process within Jira can elevate QA practices and contribute to a more efficient and customer-centric software development lifecycle.
For additional inspiration on crafting and monitoring QA KPIs in Jira, consider exploring our KPI Examples page.
Start your 30 days free trial of Performance Objectives: Charts for Jira from Atlassian Marketplace.