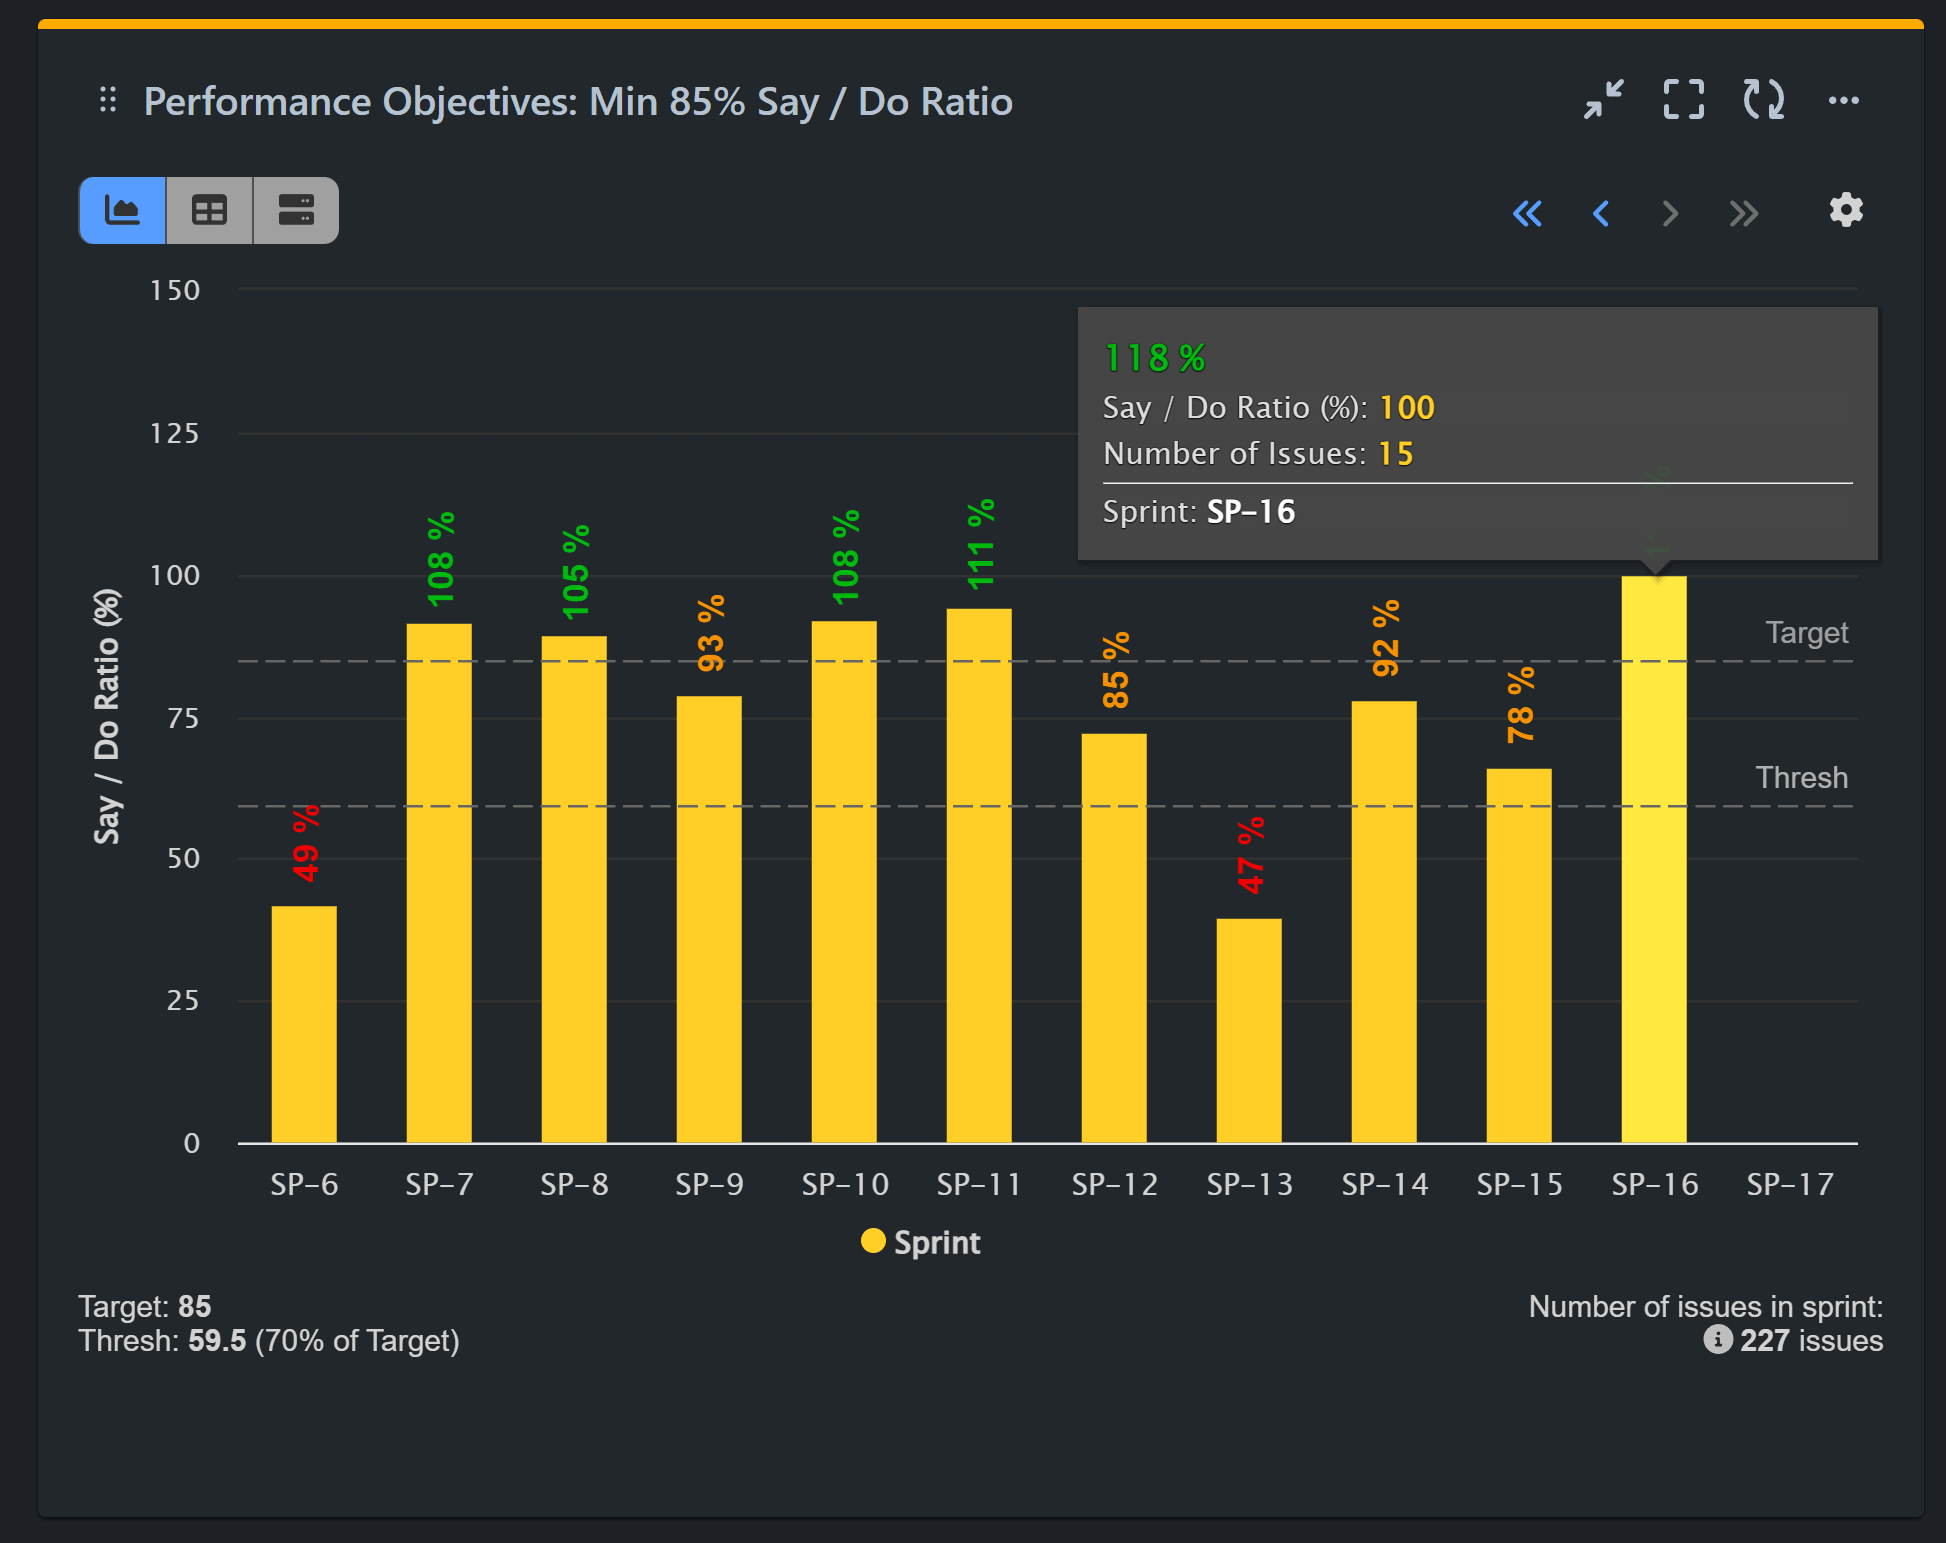
We’re excited to introduce new reporting options that enhance Sprint analysis through our updated filtering features and metrics.
This article is the first in a series demonstrating how to create various Sprint KPIs using the Performance Objectives app, enabling you to significantly enrich your sprint insights directly on Jira Dashboard.
Configure a ‘Say-Do Ratio Report’ Using the Performance Objectives Dashboard Gadget
The say-do ratio is a concept often used in agile methodologies, particularly in the context of agile teams’ communication and accountability. It refers to the relationship between what someone says they will do and what they actually do. The ratio is calculated by dividing the number of promises made by the number of promises kept.
In agile environments, where frequent communication and collaboration are key, maintaining a high say-do ratio is important for building trust within the team and with stakeholders. When team members consistently follow through on their commitments, it fosters an environment of reliability and accountability.

Follow these simple steps to build your Say / Do Ratio report:
Step 1: Add Data source. In our example, we have filtered our Scrum demo project ‘Aqua’ and have disabled the date range to view all previous sprints.
Step 2: Select ‘Story Points’ metric in the measure section. You can create the same report using ‘Number of issues in Sprint’ metric. The only change in the described steps will be the metric selected.
Step 3: Choose Sprint for ‘Display by‘ field to uncover more filtering options for your ‘Story Points’ metric and add the Sprint Board you want to analyze.
Step 4: Go back to ‘Story Points’ metric and select Formula Metric tab.
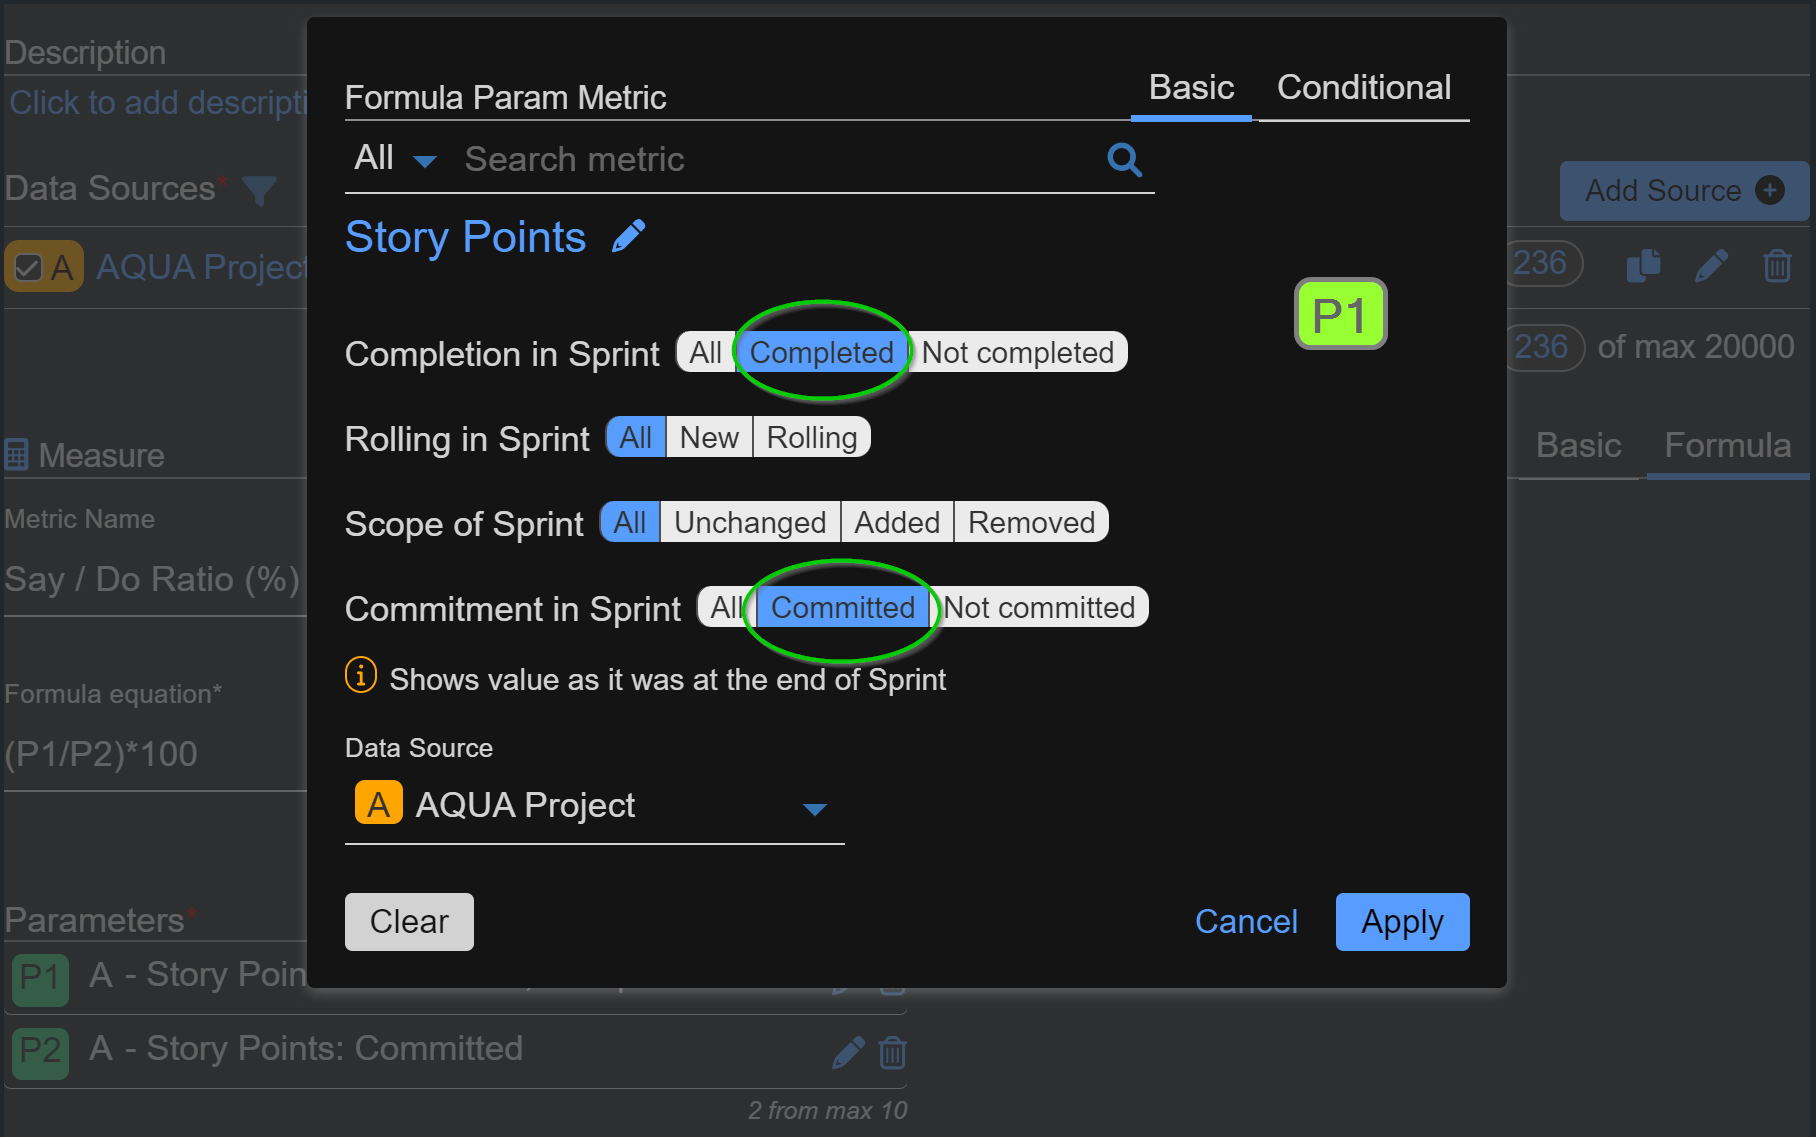
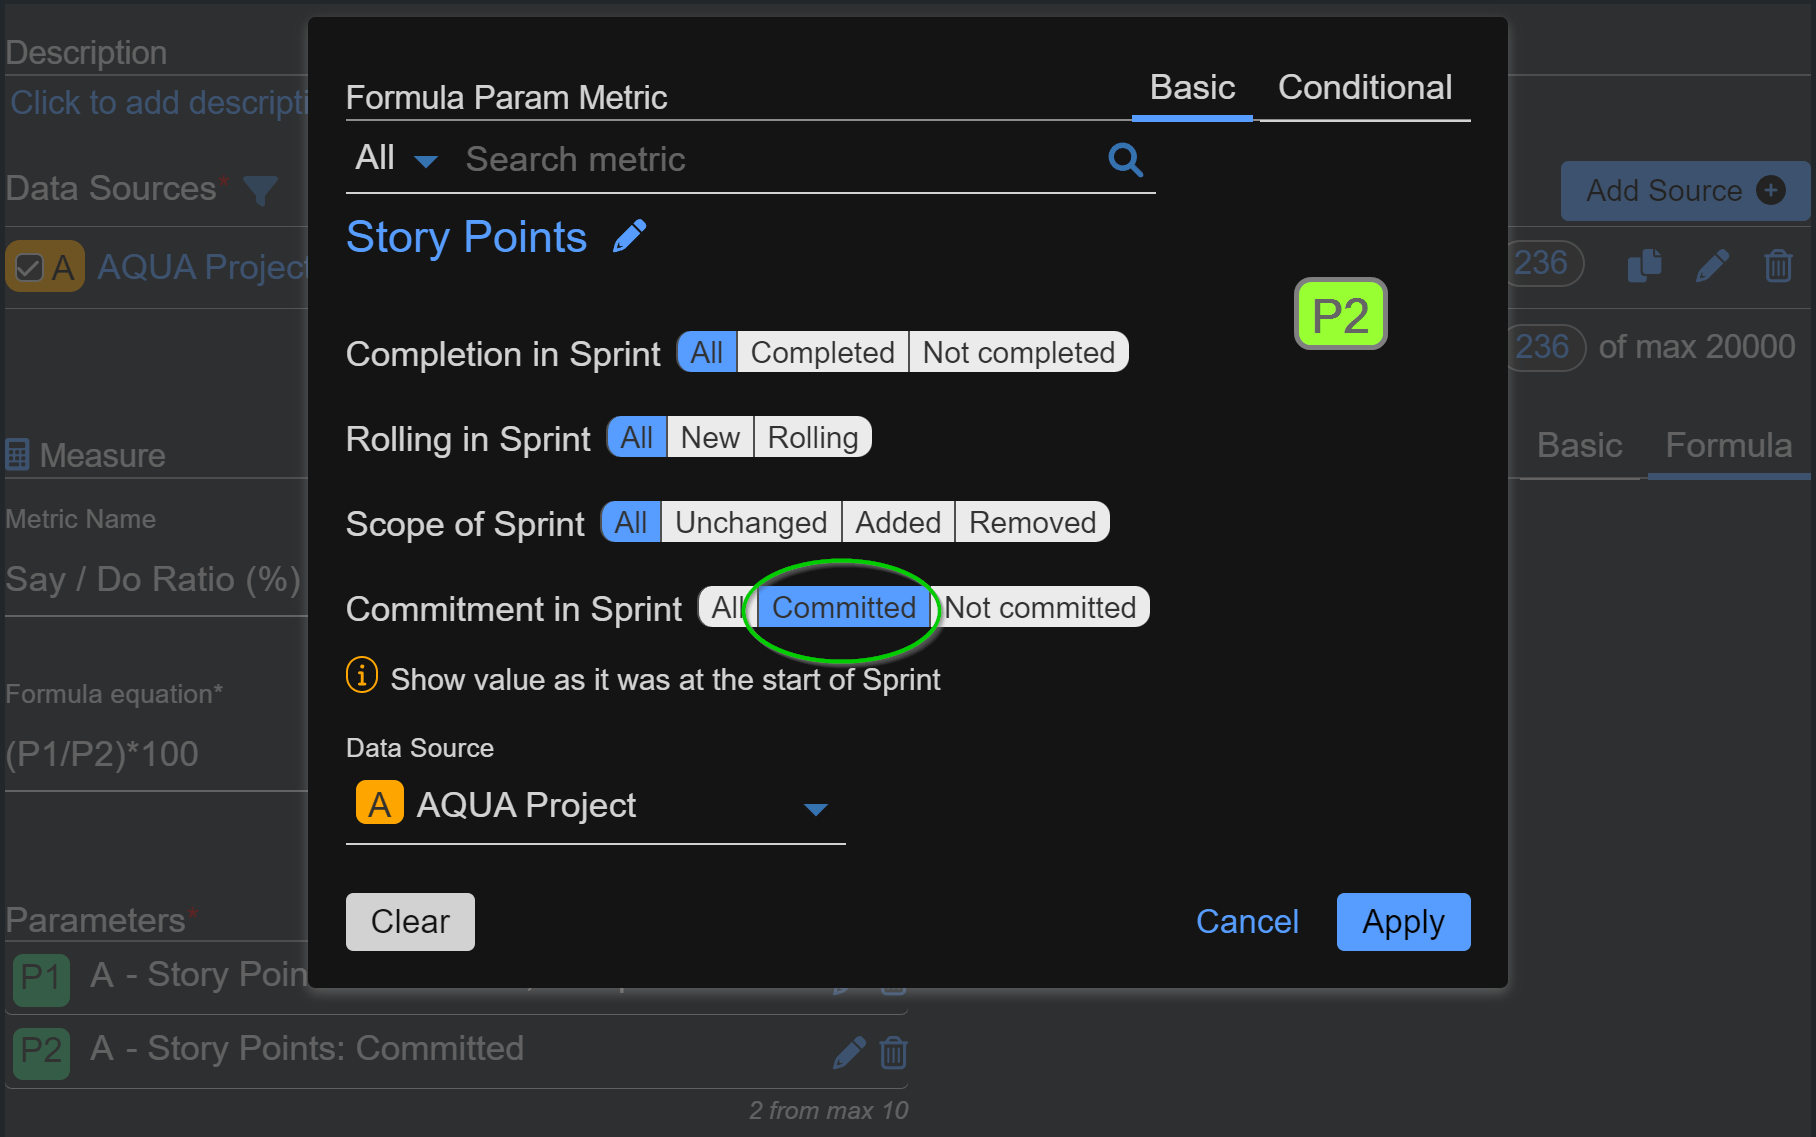
Step 5: Add two parameters for your Say-Do Ratio formula:
Parameter 1(P1): A – Story Points: Committed, Completed

Parameter 2(P2): A – Story Points: Committed

Please note that any user stories added after the sprint started are disregarded with this selection, as they are not part of the Sprint commitment.
Step 6: Add formula equation: (P1/P2)*100 to calculate the ratio in %.
Step 7: Assign a custom name to your formula metric like ‘Say / Do Ratio (%)‘.
You can save the report and explore the results or you can proceed to add a target for your custom indicator. To do so, please follow the additional steps:
Step 8: Turn on the Target section and select the ‘Fixed’ tab.
Step 9: Choose the ‘Per x-axis’ option to target percent completion per Sprint. Set a value based on your team’s experience, past performance, and maturity. For instance, we set it to 85% with the exceeding button set to ‘Good’.
Step 10: (Optional) Add a warning threshold of your choice as an early indicator of reduced accountability.
Please consult the video below for a detailed, step-by-step configuration guide:
To explore more about our app’s features, refer to the User Guide, gain inspiration from our KPI Examples or contact our Support team for demo or assistance!
Start your 30 days free trial of Performance Objectives: Charts for Jira from Atlassian Marketplace.