Creating a PoP Improvement ( Period over Period) report in Jira offers valuable insights into the trajectory of your team’s performance. Performance Objectives app stands out as one of the few reporting tools for Jira offering users the unique capability to easily compare one time period to corresponding periods in the past, such as week-over-week, month-over-month, year-over-year, and more.
By monitoring changes over successive periods, this report provides a dynamic view of progress, emphasizing continuous improvement over time. Such an approach empowers teams to identify trends, make informed decisions, and foster a culture of growth within their projects. In this article, you can explore the capabilities of the Performance Trend gadget and discover how it can enhance your performance management process within Jira.
Create a PoP Improvement Report with a Reduction Goal for Bugs
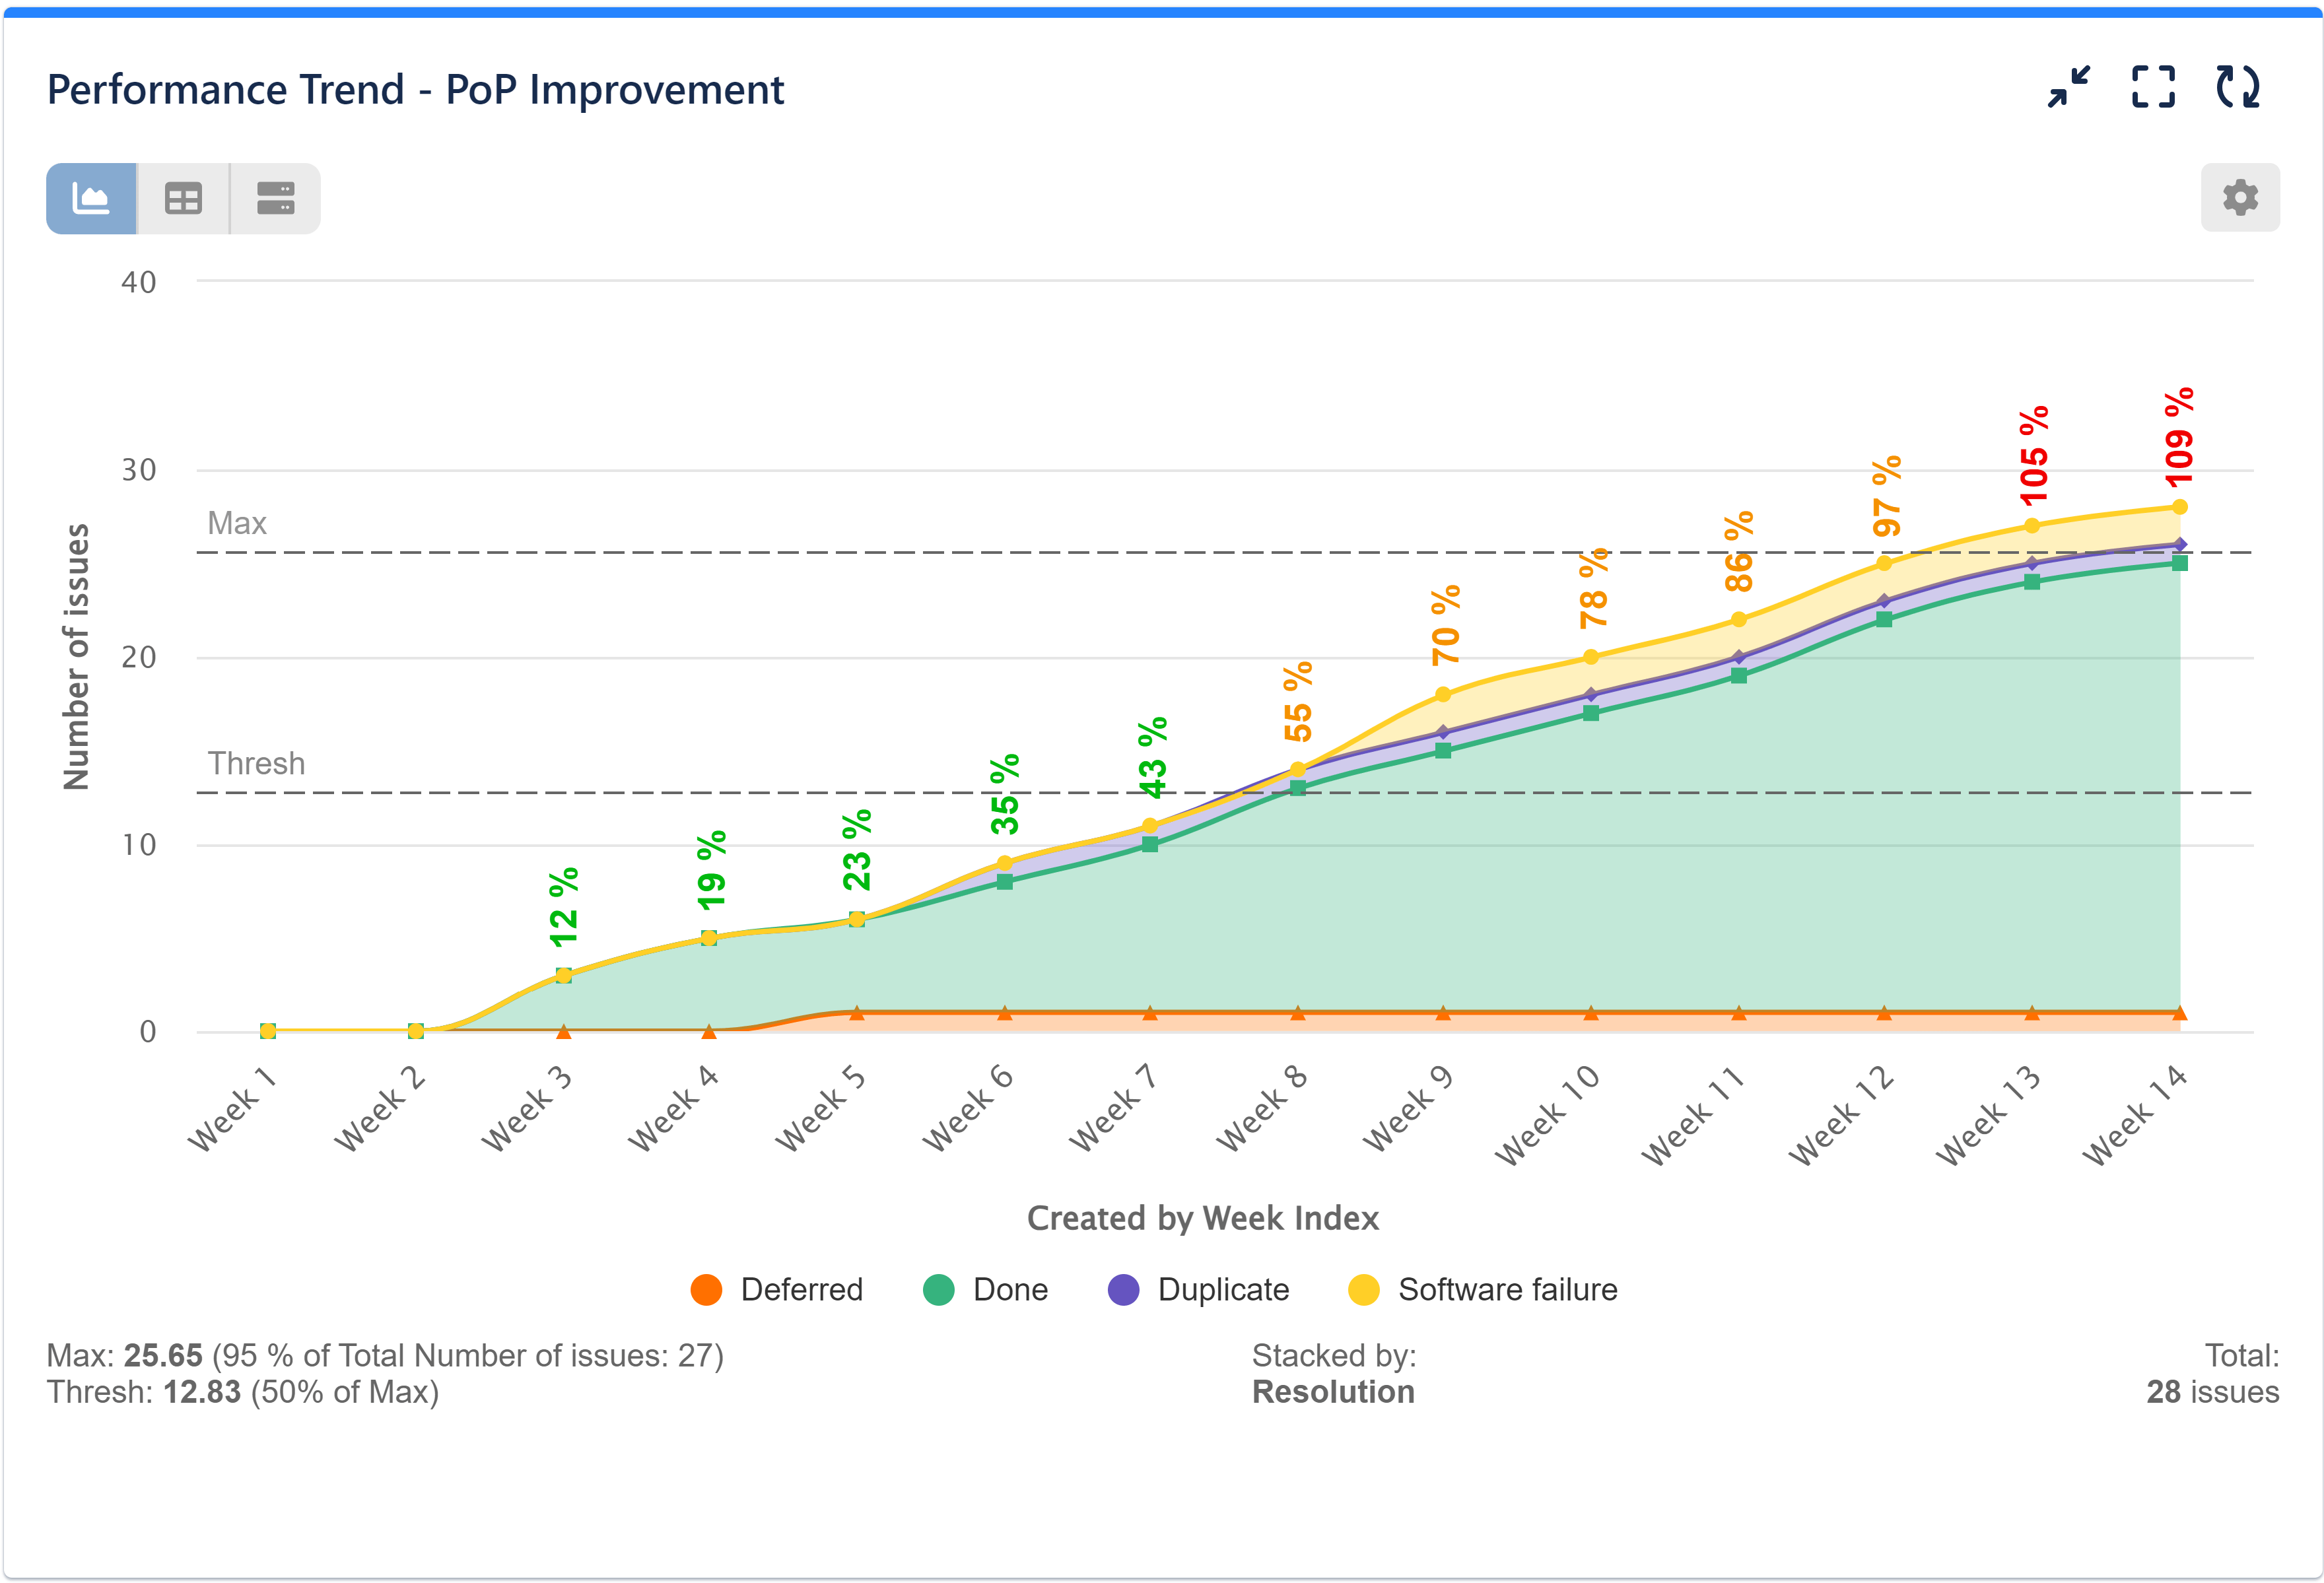
Set a PoP (Period over Period) goal for a % decrease of total bugs compared to the previous period. The example KPI configuration aims at 5% reduction of bugs quarter on quarter (QoQ).

Here’s a comprehensive step-by-step guide to creating a PoP Improvement report in Jira using the Performance Trend gadget.

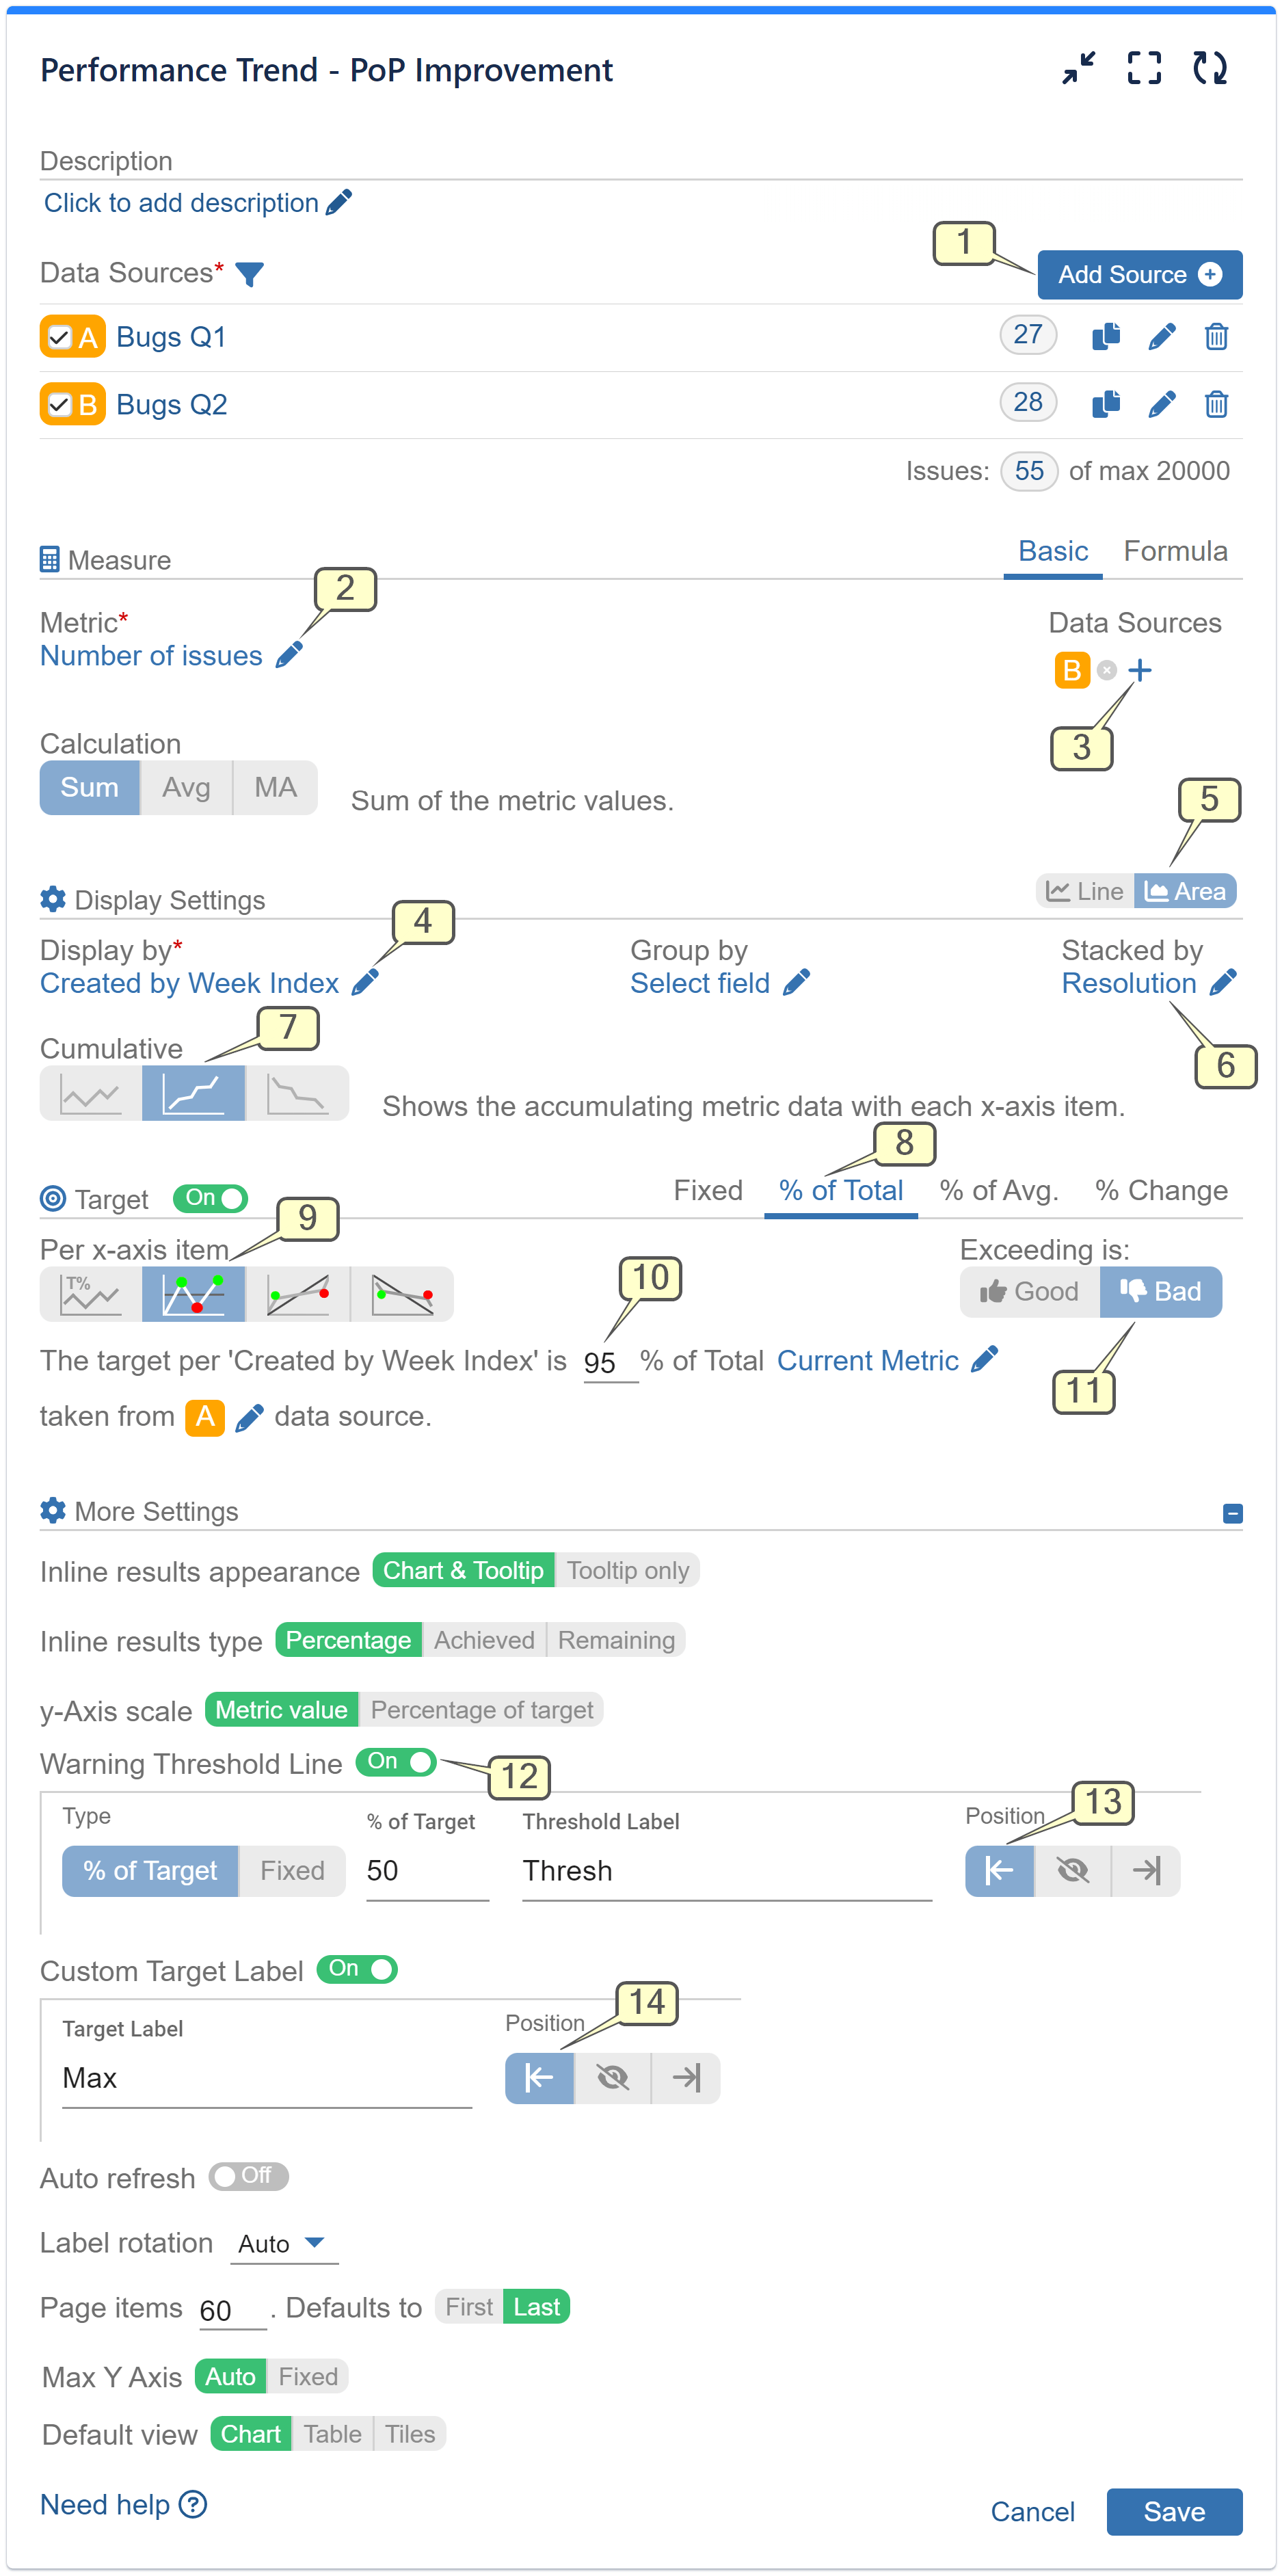
Step 1: Add 2 Data Sources for the desired comparative periods. In our example we have used two consecutive quarters, but you may opt for YoY, MoM, etc. analysis.
Step 2: Choose ‘Number of issues’ metric.
Step 3: Select Data Source B containing Bugs Q2 data for the chosen metric.
Step 4: Opt for ‘Show Data by Index’ for the ‘Created’ date, enabling simultaneous evaluation of both periods from Data Source A and B on the shared x-axis.
Step 5: Transform the Chart Type from Line Chart to Area Chart, to get clearer representation of the magnitude of changes over time.
Step 6: (Optional) Choose ‘Resolution’ for the Stack by display option.
Step 7: Opt for ‘Cumulative’ Mode to represent data accumulation across each x-axis item.
Step 8: Activate the Target feature and select the ‘% of Total’ tab option.
Step 9: Choose to display results by x-axis item to monitor progression alongside each x-axis entry.
Step 10: Set the Target at 95% to achieve a 5% Quarter-on-Quarter (QoQ) reduction and use data source A containing Q1 data for calculating target values.
Choose the “Bad” option for the “Exceeding” display settings.
Step 12: (Optional) Enable the ‘Warning Threshold’ within the ‘More Settings’ section and set it as a percentage of the target or a fixed value. In our example, it is set at 50% of the total.
Step 13: (Optional) Position the Threshold Label on the left to prevent overlapping with the Cumulative Mode’s dense chart data on the right.
Step 14: (Optional) Align the Target Label’s position with the left, as previously indicated.

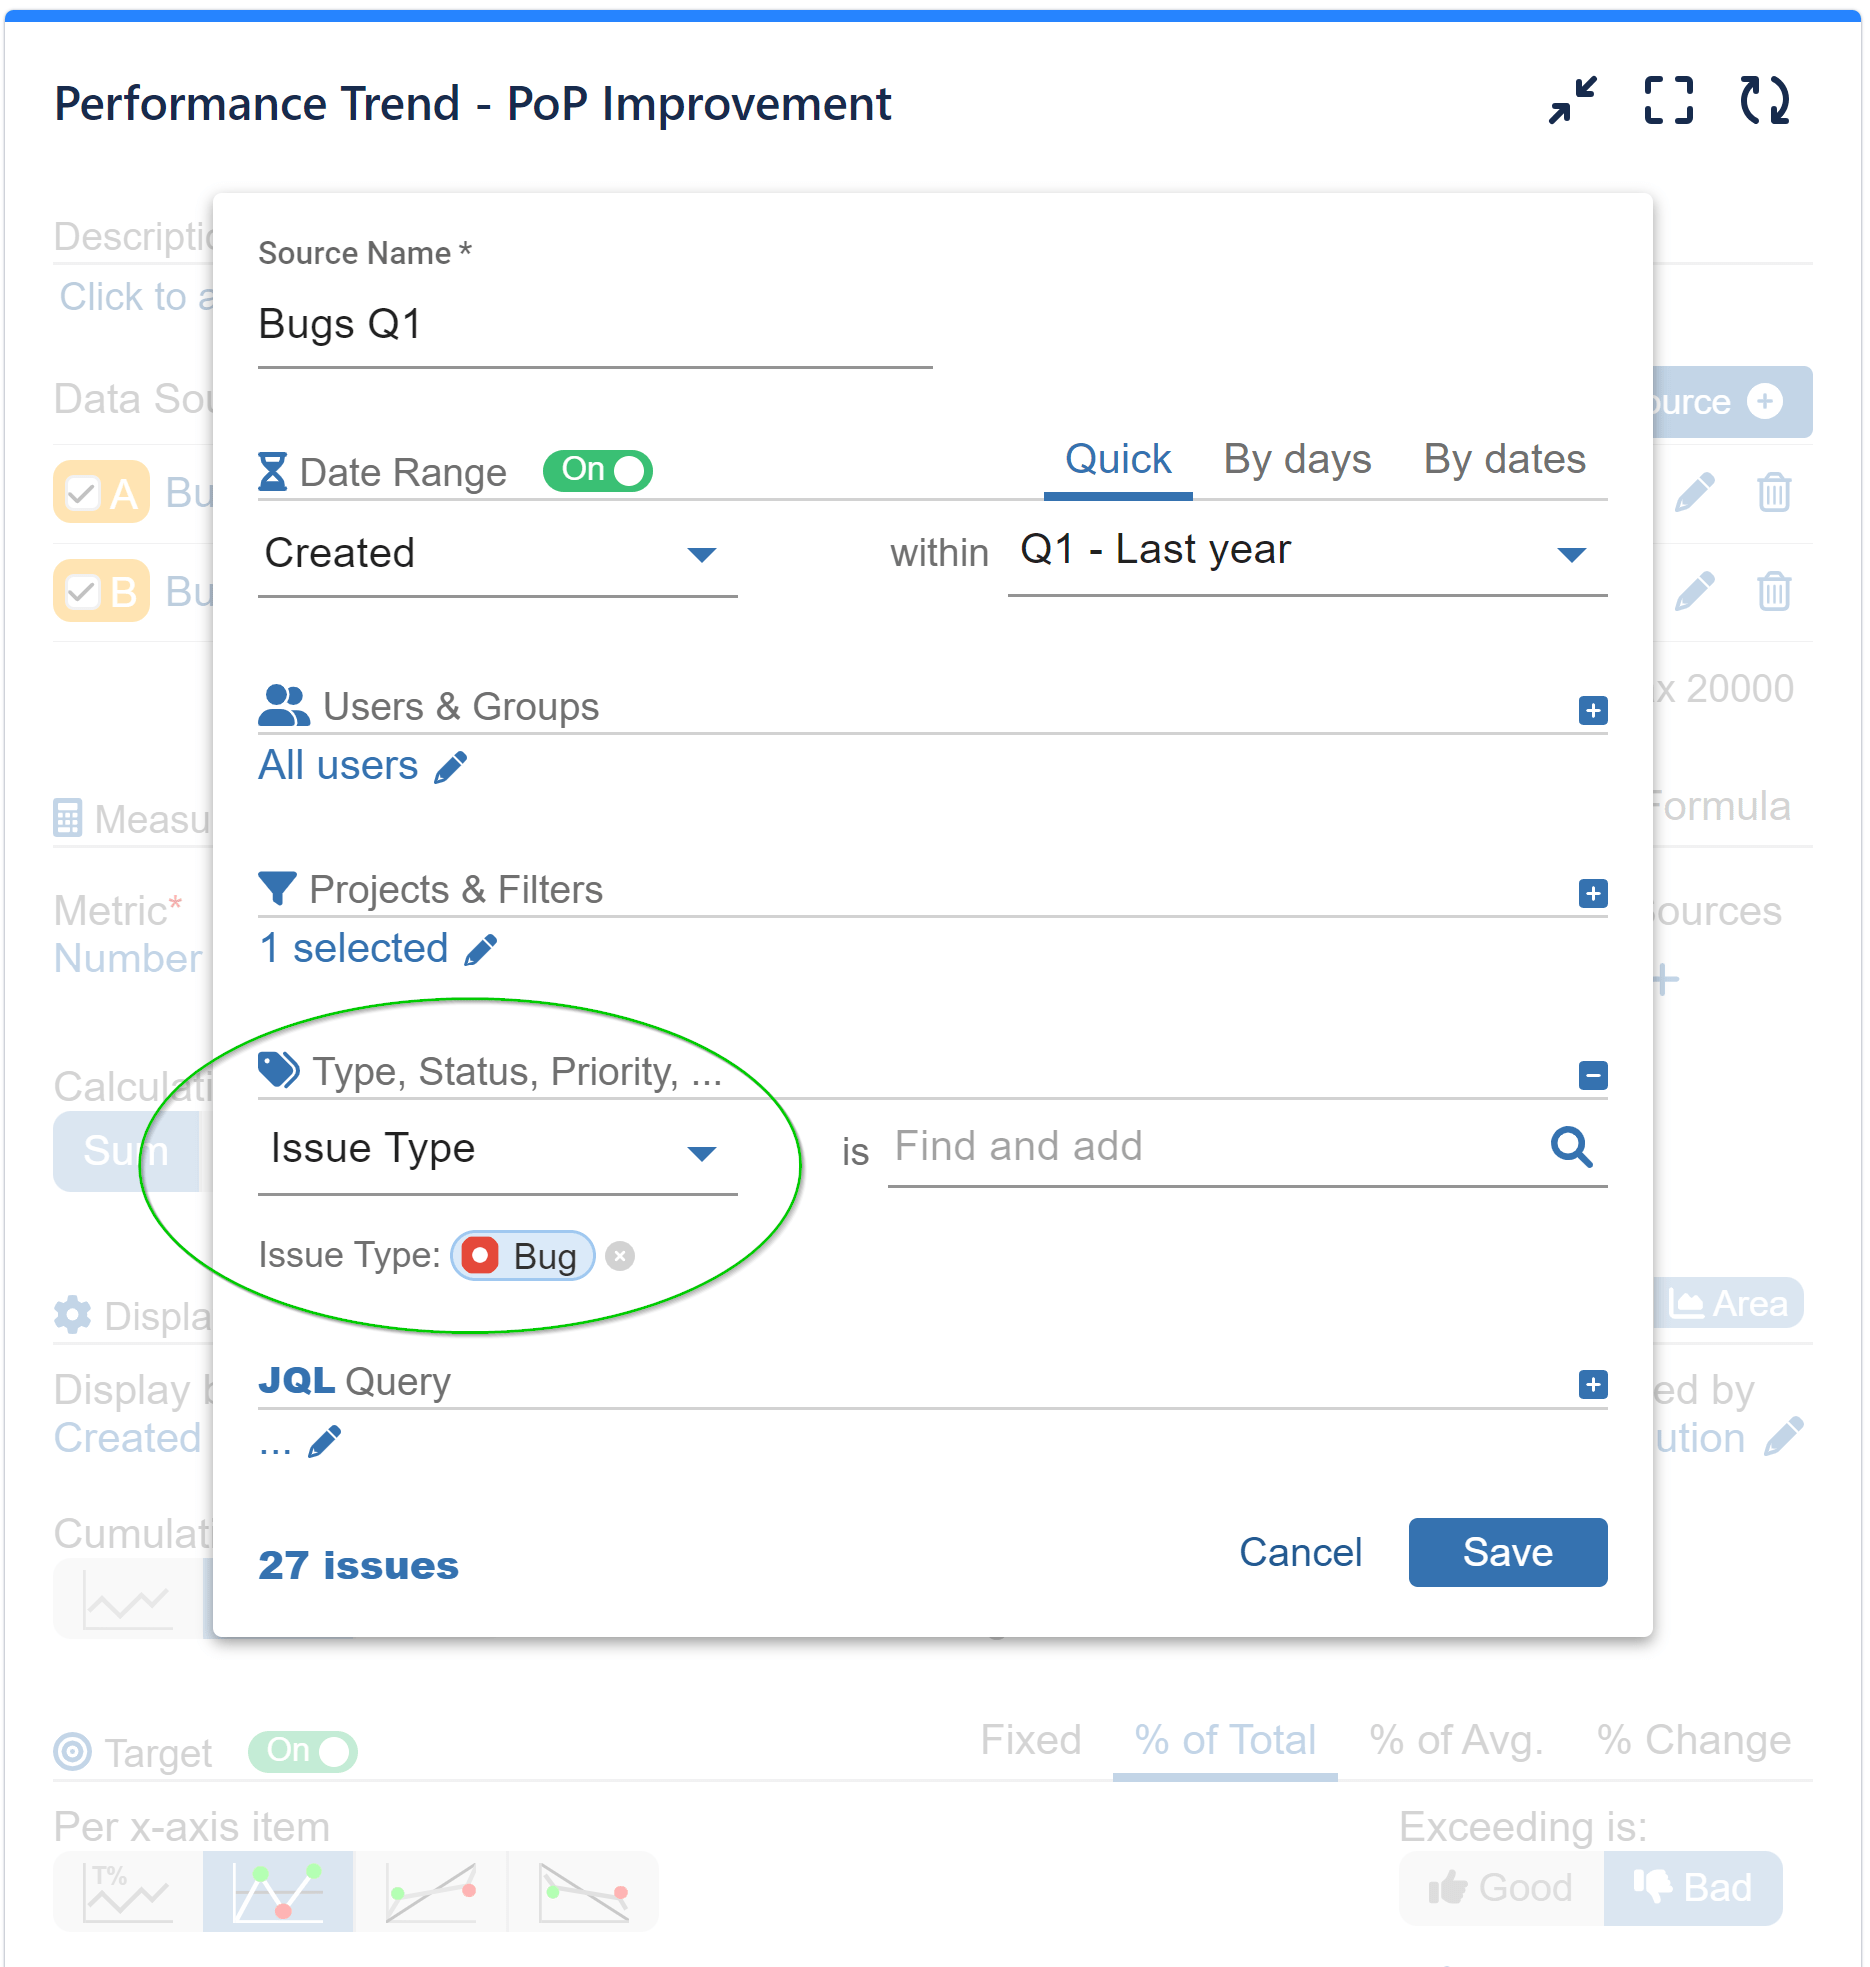
Here’s how to utilize the data segmentation feature of Performance Objectives: Charts for Jira to filter on the “Issue type” Bugs in both of the Data Sources you’ve employed for your PoP improvement comparison report in Jira.
Presenting a Recorded Video Tutorial:
Setting KPIs based on previous periods provides a benchmark for evaluating current performance. It helps in setting realistic goals and targets, as well as tracking progress towards those goals over time.
Leverage the Performance Objectives: Charts for Jira app to create a dedicated PoP Improvement report within your “KPI Dashboard” on your Jira. This dashboard can host an array of reports aligned with your objectives, all reinforcing your SMART goals. Our support team is prepared to assist you.
For additional use cases that can enhance your performance management process, take a look at the KPI Examples page.
Start your 30 days free trial of Performance Objectives: Charts for Jira from Atlassian Marketplace.