Even though there is a popular misconception suggesting that Agile teams do not plan their work ahead, team velocity remains a foundational Agile metric essential for estimation and planning in the next sprint. Performance Objectives: Charts for Jira offers additional support for sprint segmentation, allowing filtering of issues present in all sprints, only in the first/last sprint, or resolved/unresolved in a sprint.
Jira teams may face challenges when estimating their velocity accurately. However, the Performance Objectives app can enhance your Velocity-based Sprint Planning. With its dynamic fields and options, the app ensures more precise sprint insights from your Jira data.
Below are several features designed to enhance your sprint reporting in Jira:
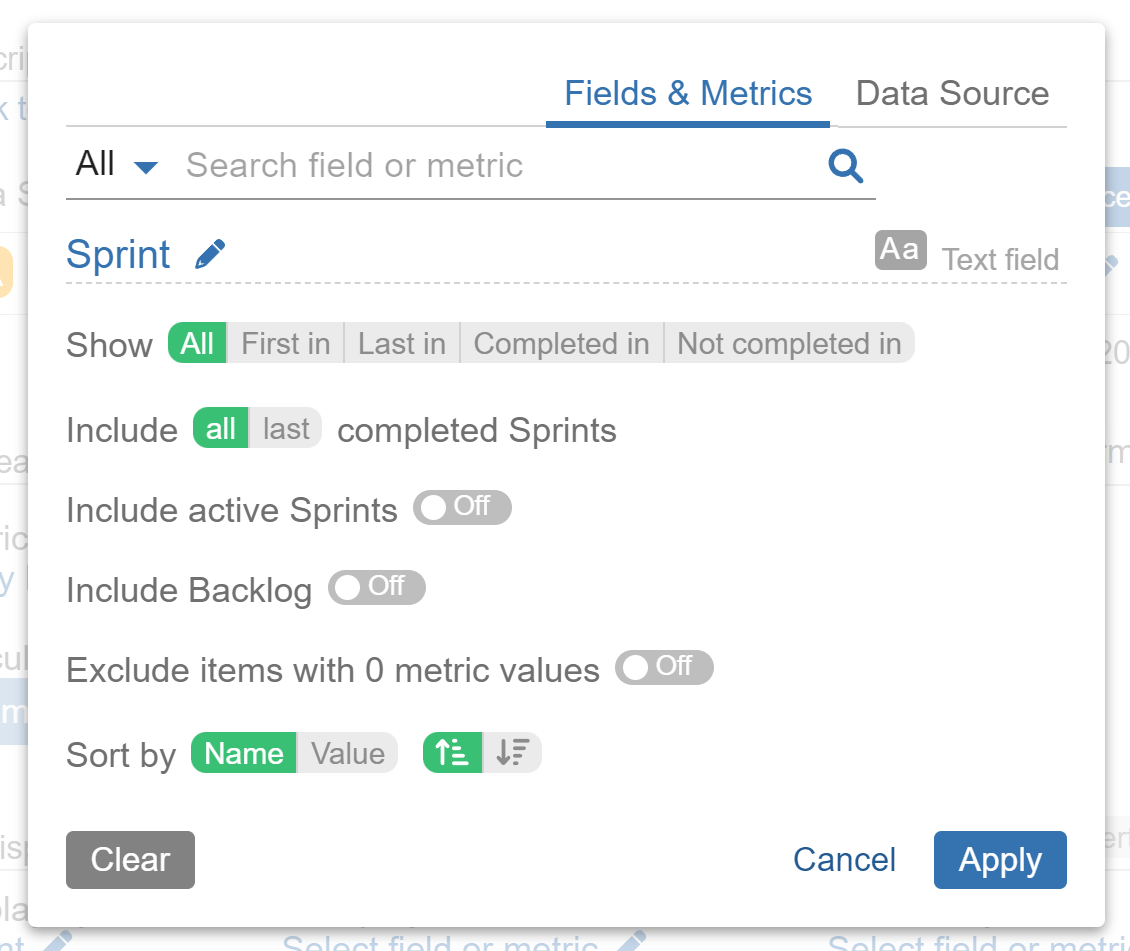
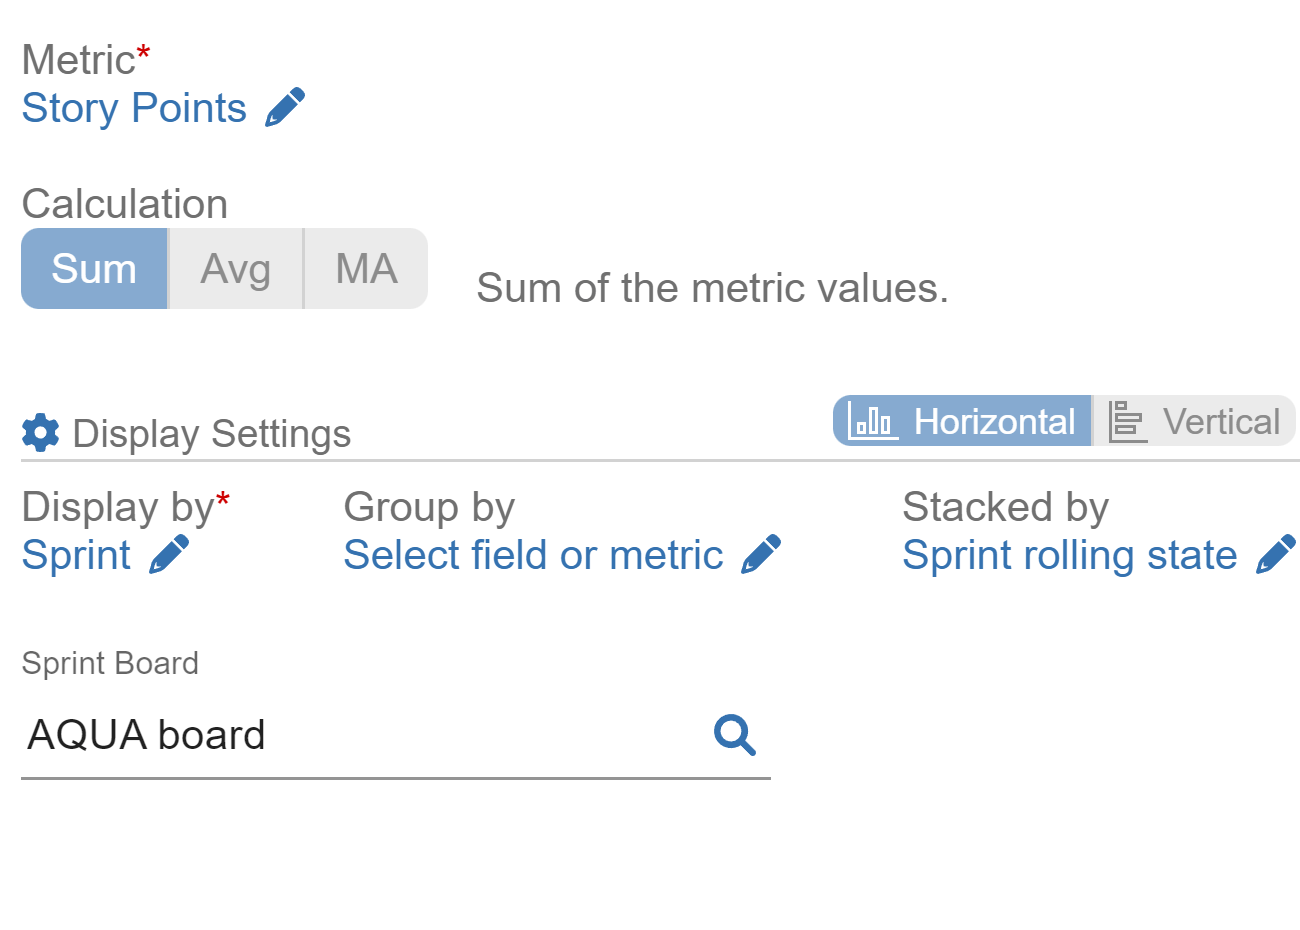
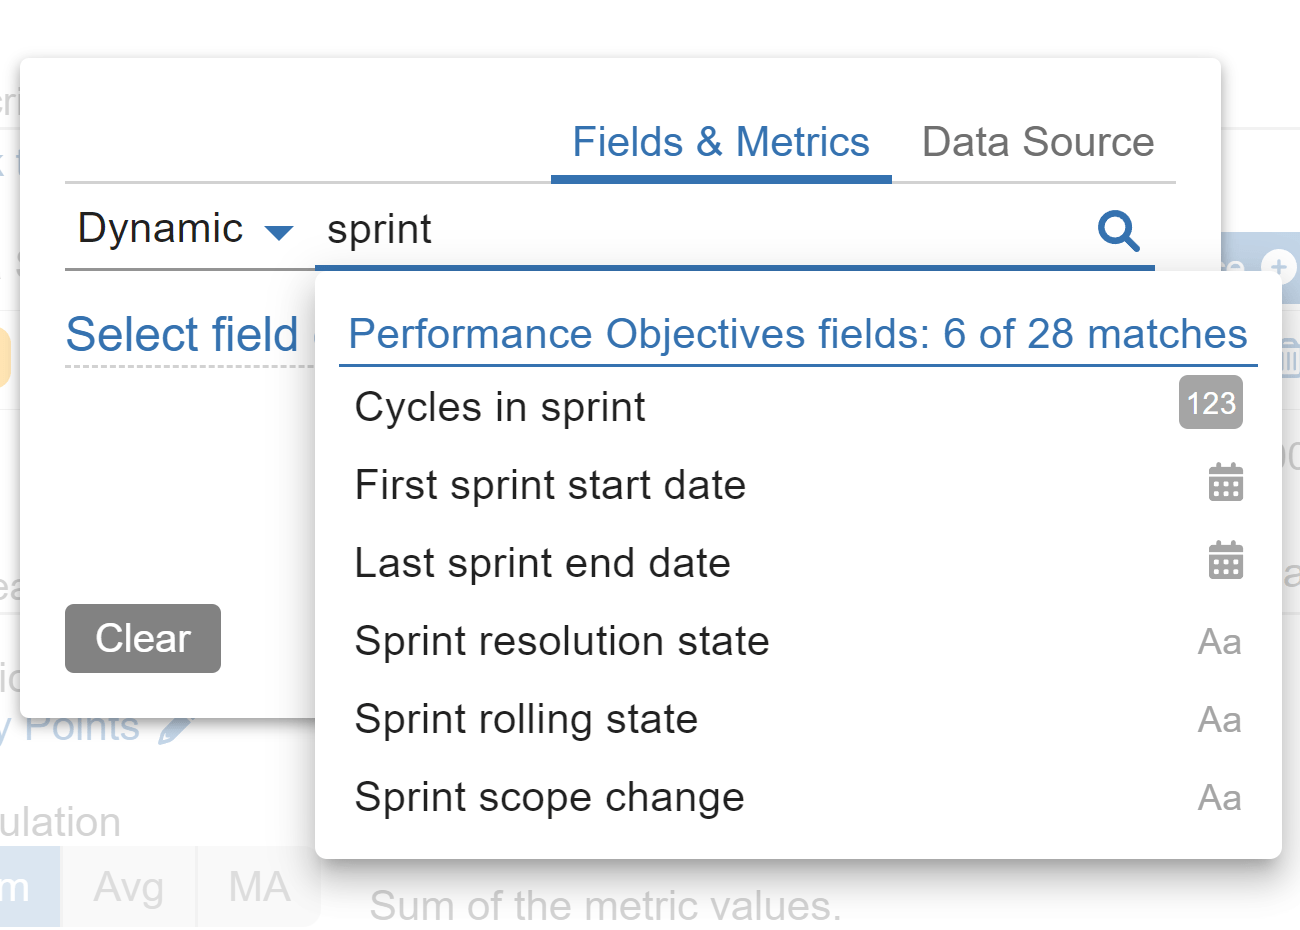
If you display by the Sprint field, you have the option to include both active sprints and backlog issues in your analysis. By default, for new configurations, these options are toggled off.
You also have the flexibility to include all sprints or a specific number (eg. last 6) sprints in your analysis.
Moreover, Performance Objectives and Performance Trend gadgets enable target calculations directly on your dashboard, making performance management in Jira accessible and straightforward.
In this article, we will guide you on estimating your actual team velocity and setting targets for story points completed in a sprint based on the moving average of story points accomplished in previous sprints.
Track Actual Team Velocity in Jira with Issues Resolved in Sprint
This report allows you get a clear understanding of your actual team velocity per sprint. Transparency is key for accurate forecasting and planning of future sprints, as historical data on resolved issues guides teams in setting realistic goals and optimizing their workflow. Resolved in Sprint filtering option promotes accountability and collaboration within the team, as the emphasis shifts to tangible outcomes rather than merely the Story points committed. By concentrating on resolved issues, teams can better identify bottlenecks, allocate resources efficiently, and refine their strategies.
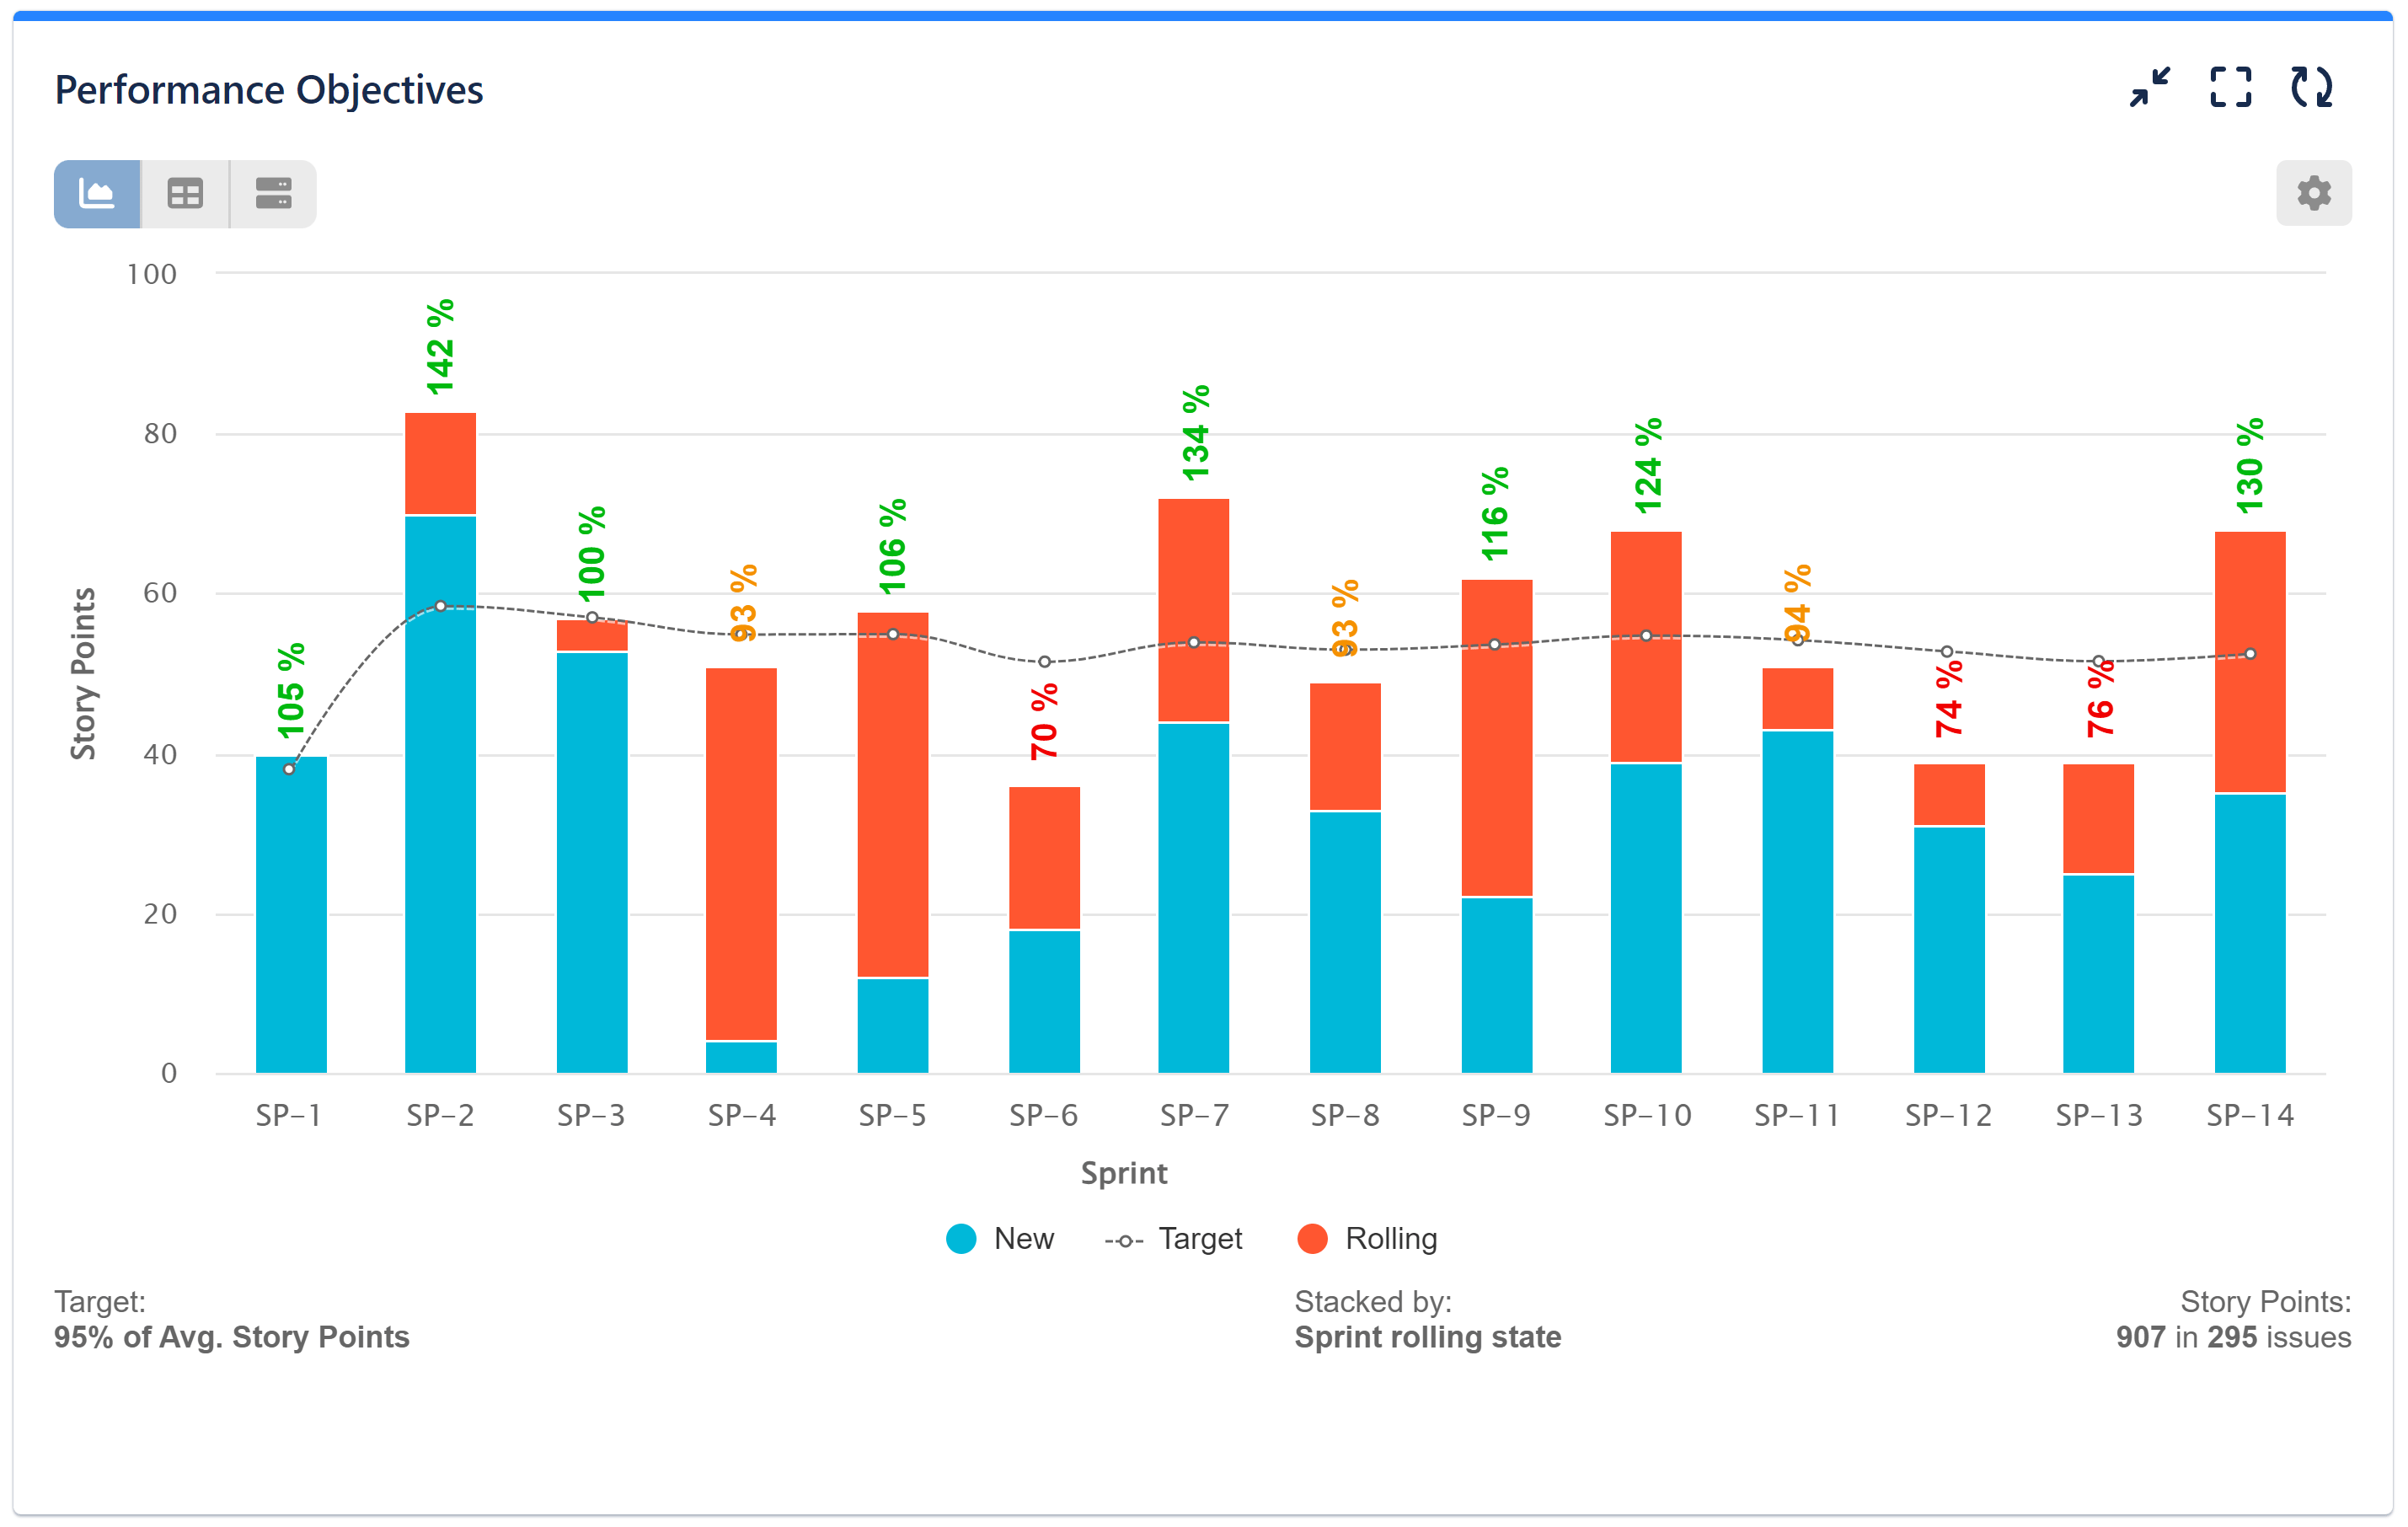
In our example Agile Team Velocity KPI report, we’ve enhanced the analysis by configuring the “Sprint rolling state” field within the Stack display option. This configuration provides a clear breakdown of resolved in-sprint issues, categorizing them into two main segments: “new” – issues and story points initially added and resolved within the current sprint, and “rolling” – issues and story points resolved within the current sprint but originating from a previous one. This distinction offers a comprehensive view of issue resolution dynamics within sprints.
Overall, this report empowers Jira users with a practical tool to enhance productivity, refine sprint planning, and foster continuous improvement in their agile processes. Now, let’s delve into a comprehensive step-by-step guide for creating the Actual Team Velocity report within Jira:
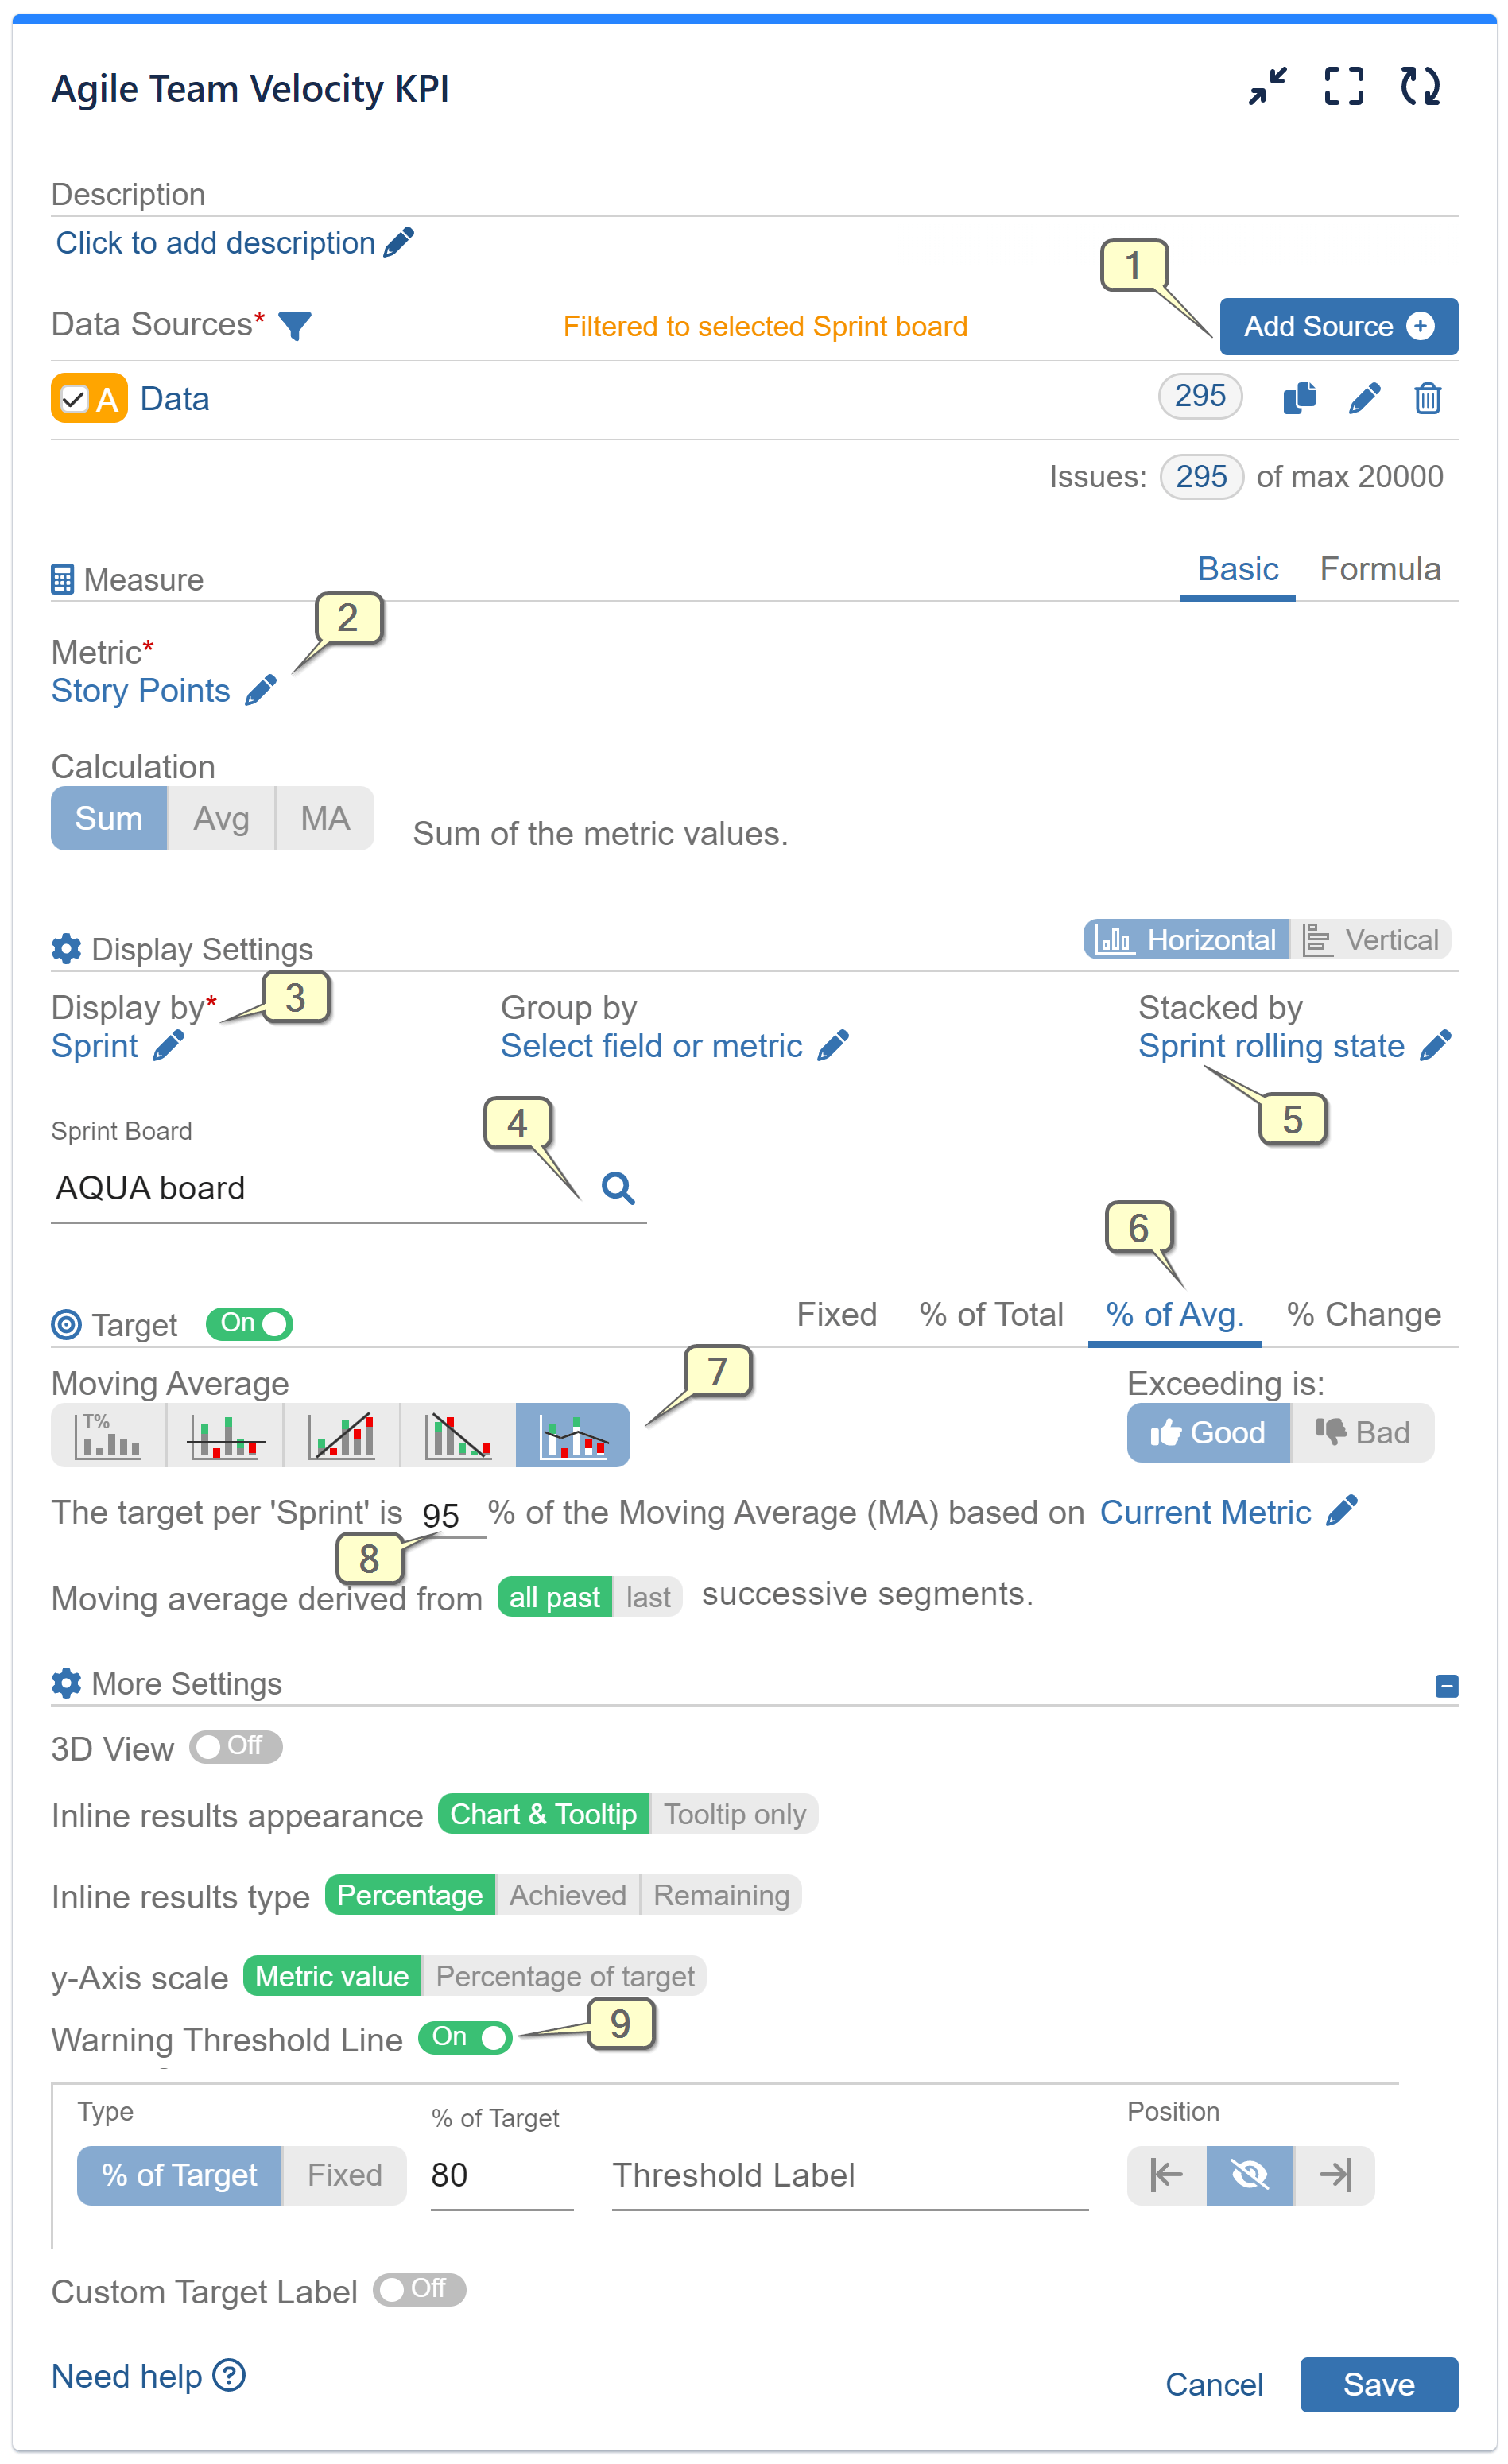
Step 1: Begin by selecting the Jira data you wish to analyze and configure it as a Data Source.
Step 2: Next, choose the ‘Story Points’ metric.
Step 3: For the x-axis, opt for ‘Sprint’ and set it under the ‘Display by’ field. To filter story points completed in the sprint, select “Resolved in.”
Step 4: Whenever you opt to display results by Sprint, you’ll have to select a Sprint board to generate the report. This step is mandatory and ensures accurate sprint reporting.
Step 5: (Optional) Stack by “Sprint rolling state” field to distinguish between resolved story points newly added to the current sprint and those that are rolling over from previous sprints.
Step 6: Switch-on Target section and select ‘% of Avg’ tab.
Step 7: Evaluate Targets per Sprint as Moving Average (MA) of the Story Points of the previous Sprints.
Step 8: Set target level of your choice. In our example it is 95% of the Avg. Story Points calculated as MA derived from all past sprints. Keep the ‘Exceeding is good’ selection.
Step 9: (Optional) Under the ‘More Setting’ section enable and define ‘Warning threshold’. The results above the threshold and under the target level will be colored in amber on the chart.
Please refer to the following video for a detailed guide on configuring Agile Team Velocity KPI report:
Track your team’s velocity in addition to other metrics to effectively measure their progress and performance. Explore our KPIs page and User Guide to discover how our app can provide deeper insights from your Jira data.
Use the search option on the website to find more examples of reports based on the ‘Story Points’ metric or search for sprint or other metrics you wish to track in Jira.
Start your 30 days free trial of Performance Objectives: Charts for Jira from Atlassian Marketplace.