Defects Severity Index: A Key QA Metric in Software Testing
In today’s fast-paced software development environment, effective testing is crucial to delivering high-quality products on time. QA metrics play a vital role in this process, serving as a powerful tool for teams to gain a better understanding of their testing process and its effectiveness. Among these metrics, the Defects Severity Index (DSI) stands out as a key indicator of the impact of defects on your project. By focusing on defect severity and other critical QA metrics, teams can make informed decisions that not only improve testing procedures but also ensure that these procedures contribute to the timely and successful release of a quality product.
In this article, we will explore how to configure and utilize a Defects Severity Index report in Jira, empowering your team to enhance both the efficiency of your testing efforts and the overall quality of your final deliverables. This report enables you to monitor the overall impact of the defects identified by applying weights to different severity levels, reflecting the increasing impact of defects as their severity level rises. In our demonstration, we utilize the Jira system field “Priority.” Nonetheless, you have the flexibility to create a similar report using your custom fields for severity and/or priority levels.
How to Create a Defects Severity Index Report in Jira
A higher severity index indicates that the defects identified are generally more severe, posing greater risks to the project’s success. It suggests the presence of critical or high-severity defects that could lead to significant problems if not addressed promptly, such as system crashes, security vulnerabilities, or major functionality failures. High-severity defects often require more time and effort to resolve, potentially leading to delays in the project timeline.
A lower severity index indicates that the defects are generally less severe, with fewer critical issues that could impact the project’s overall success. With fewer critical defects, the project is more likely to stay on schedule, and the development team can focus on polishing the product rather than firefighting major issues.
Here’s a step-by-step guide on configuring the Defects Severity Index KPI Report in Jira using the Performance Objectives app.
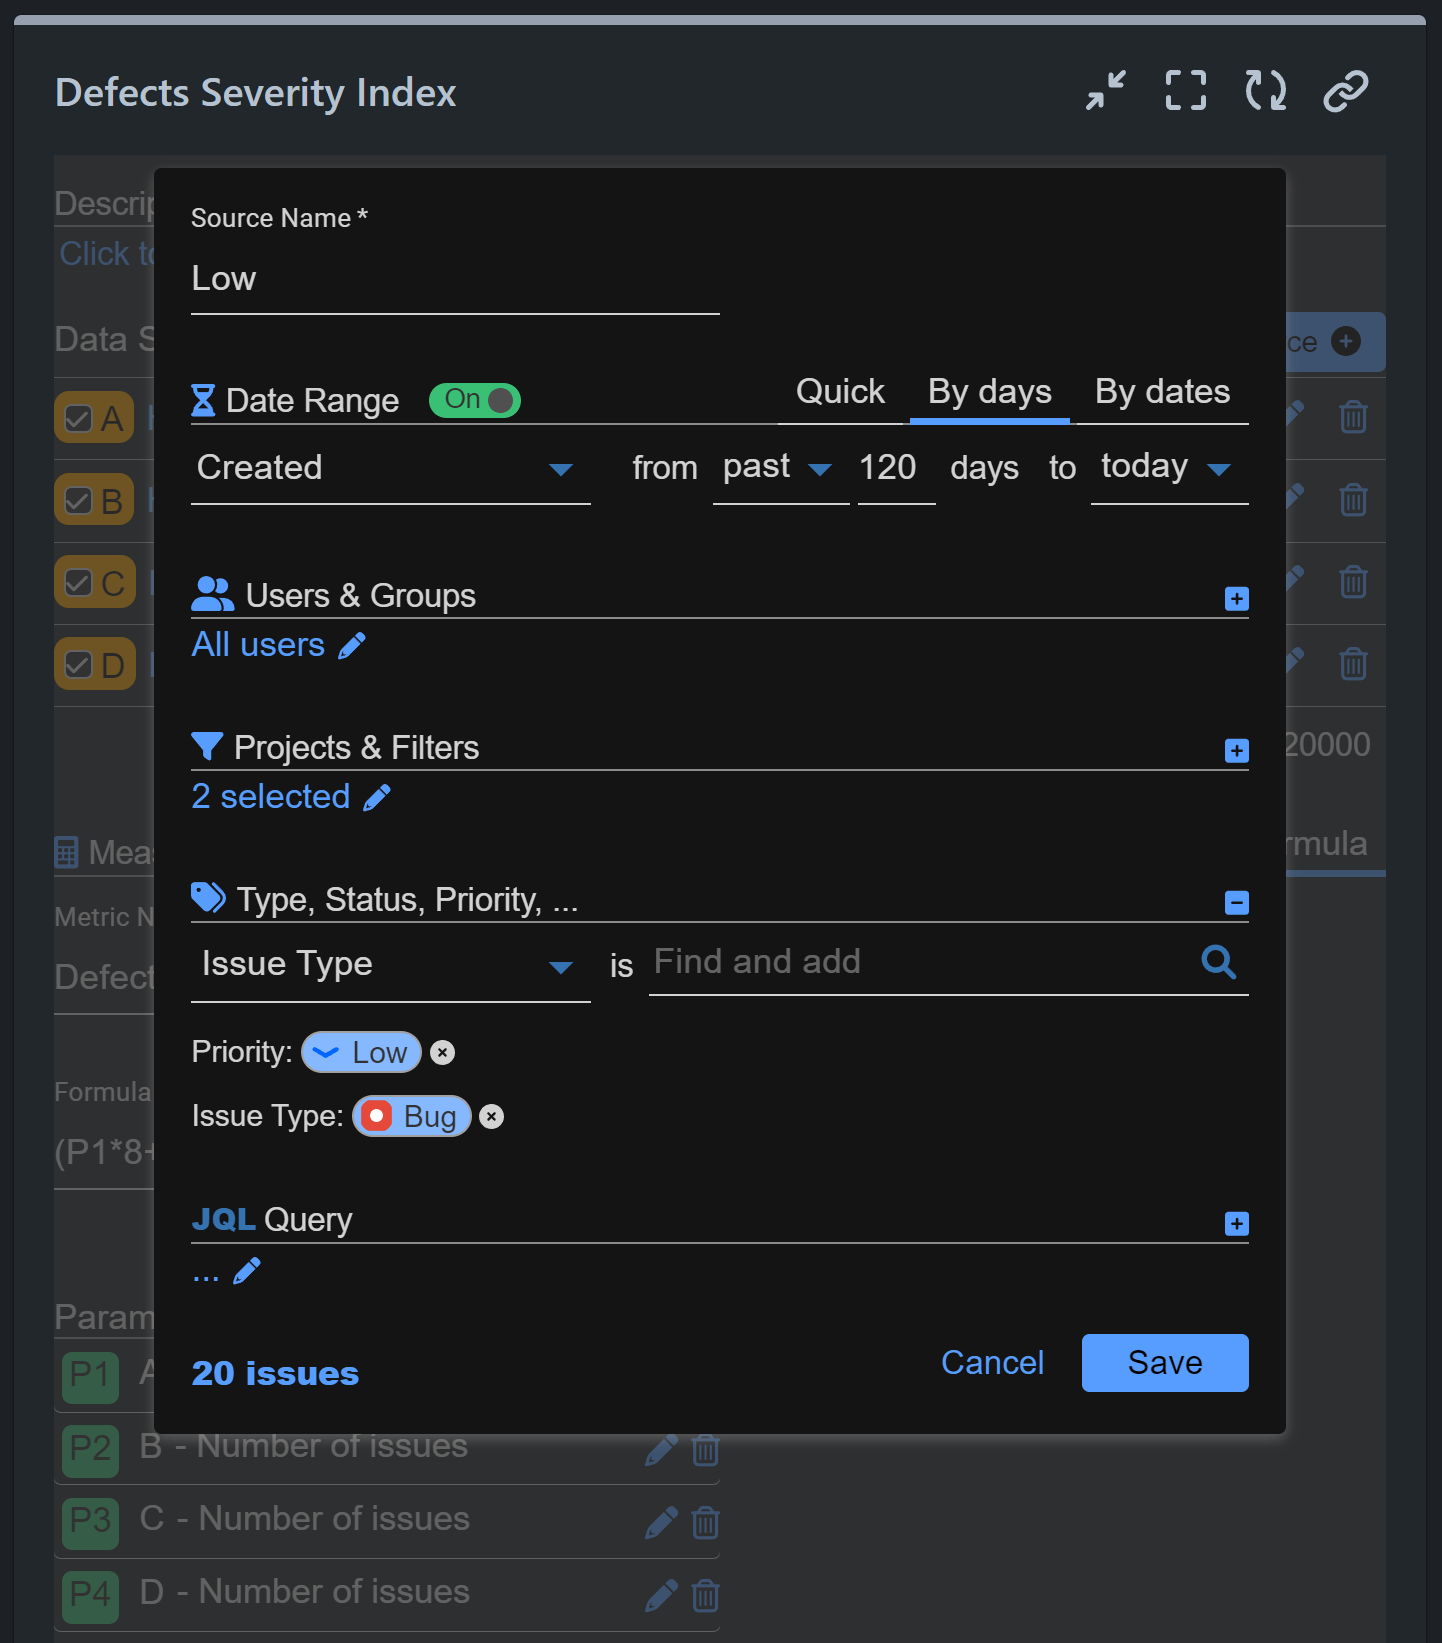
Step 1: Generate multiple data sources displaying bugs with distinct levels of priority created within the same time period.
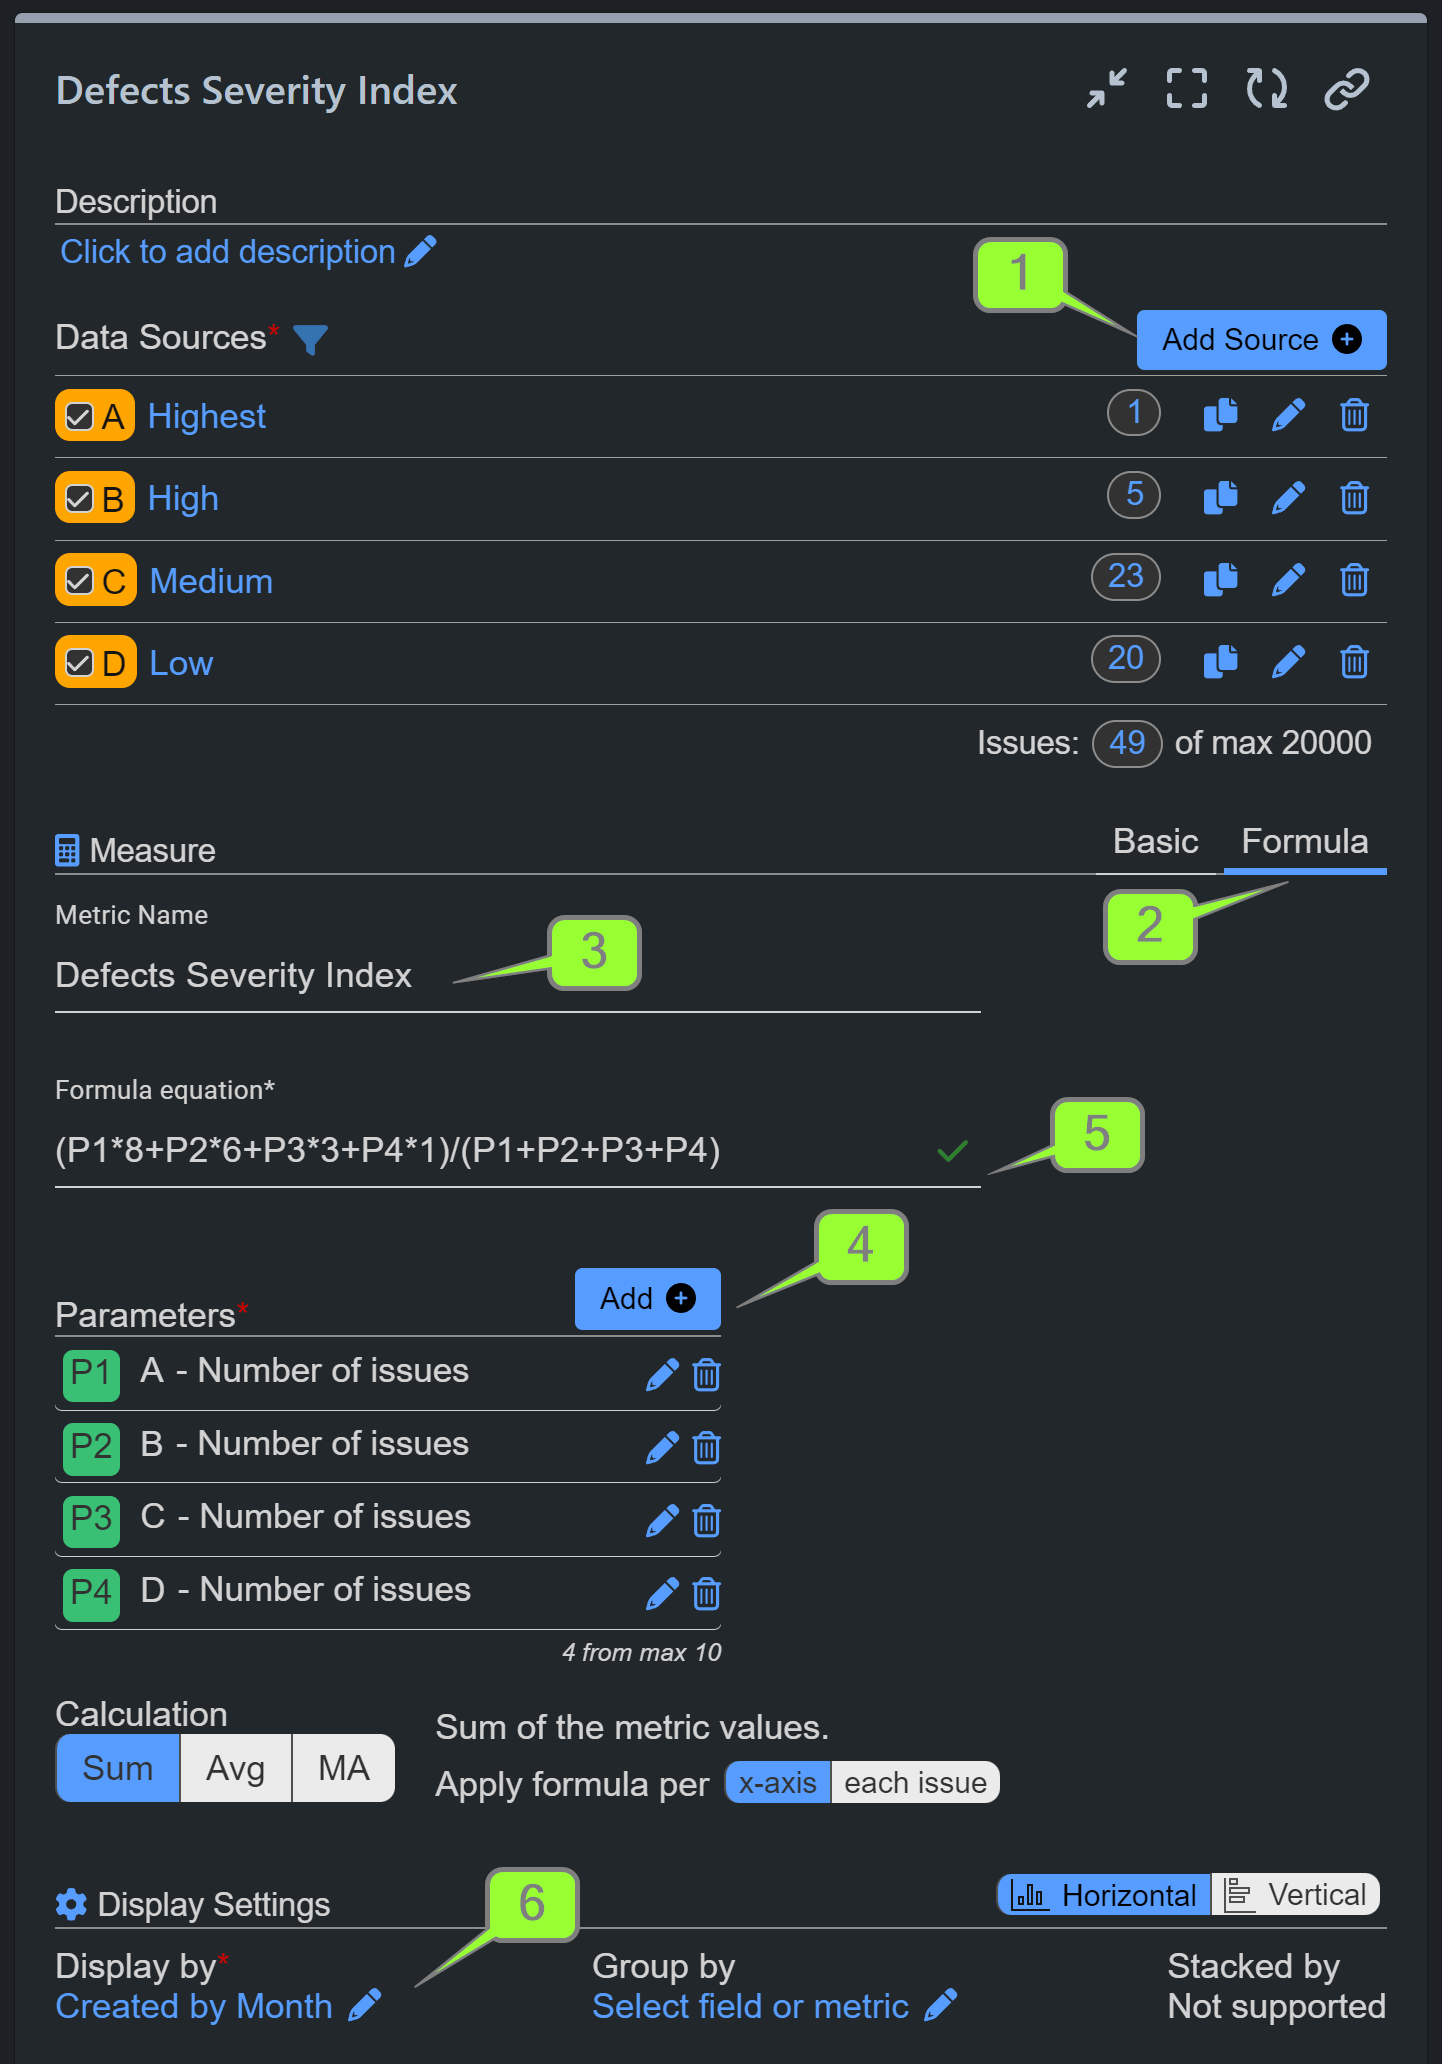
Step 2: Select Formula Metric calculation.
Step 3: Give your custom formula metric a name.
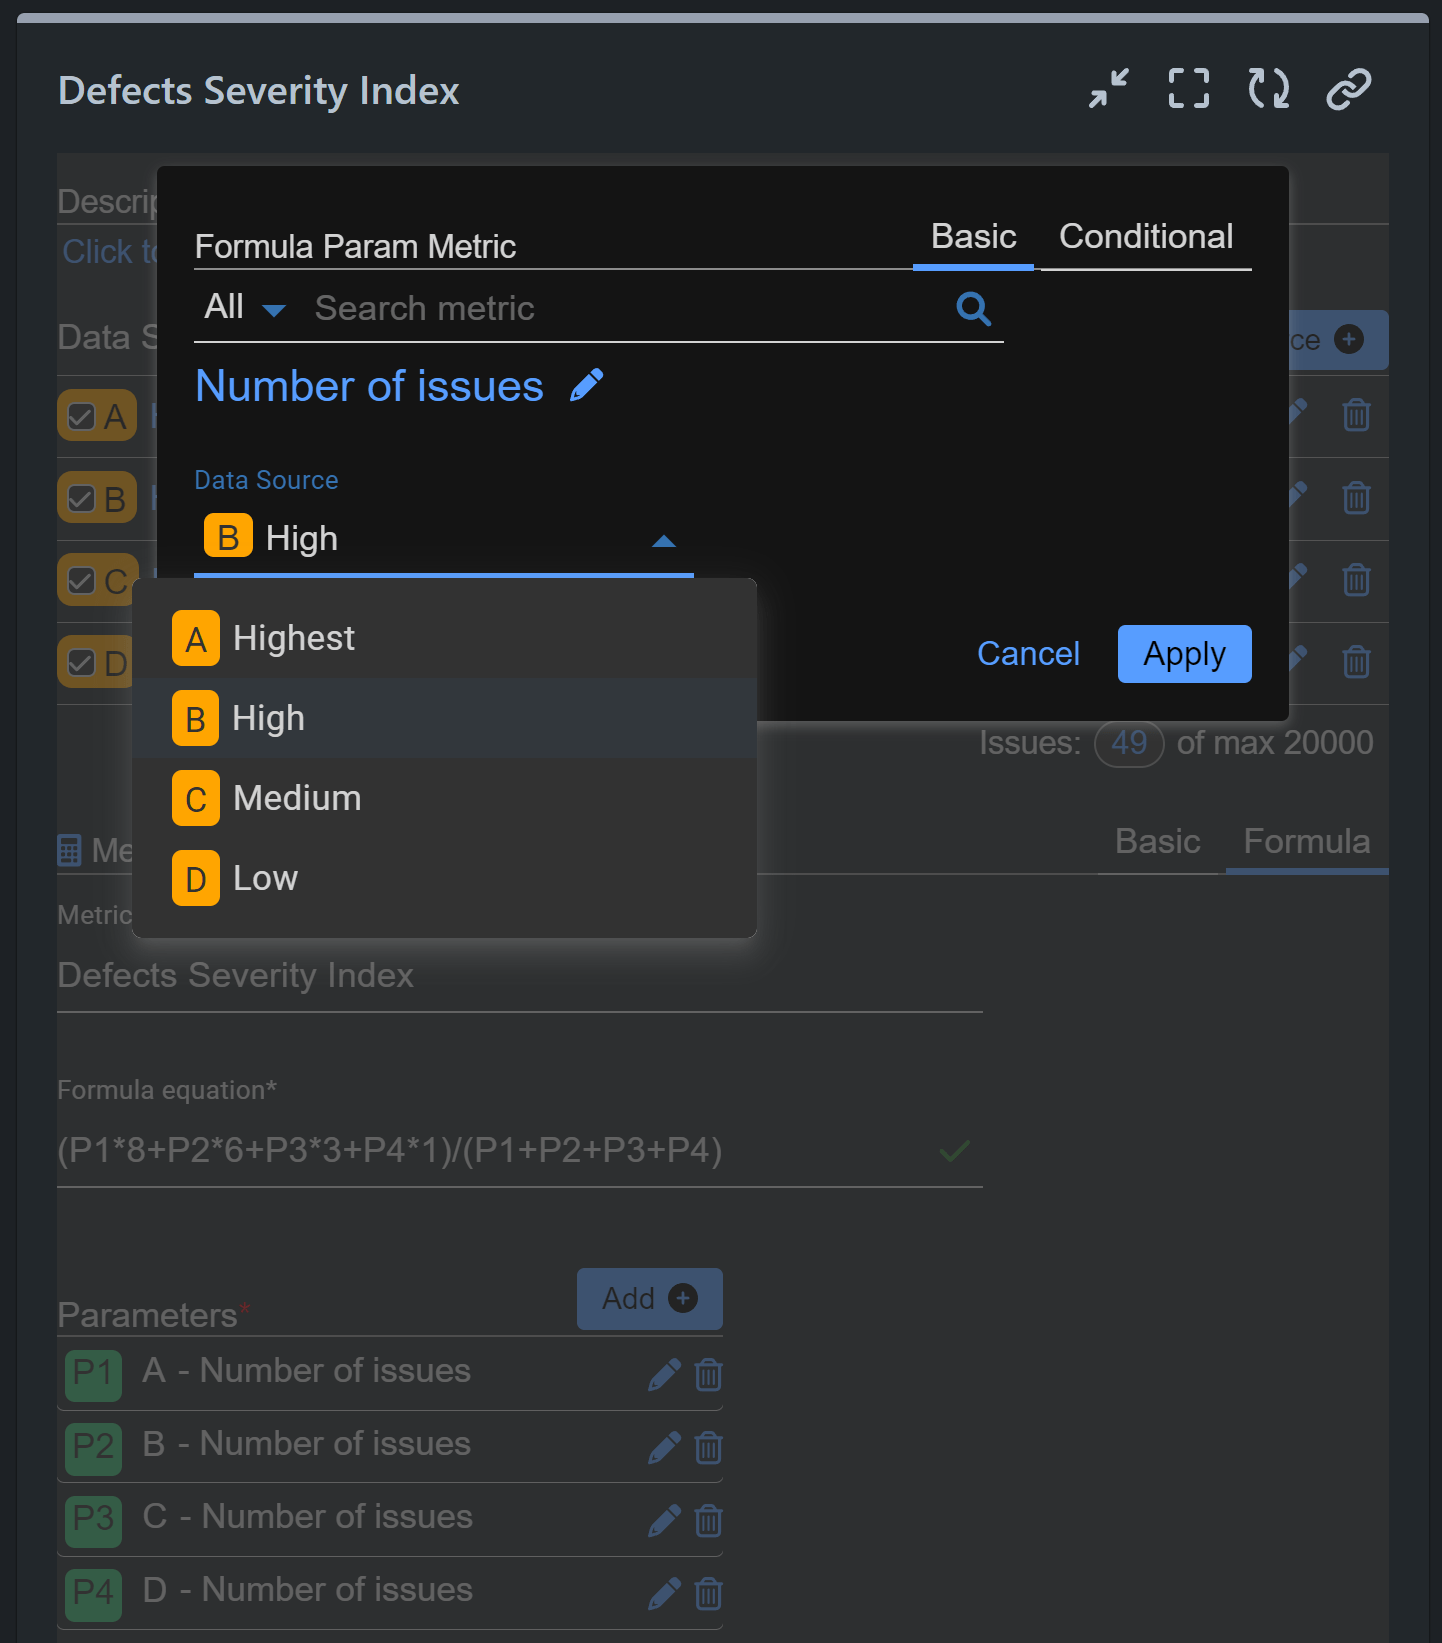
Step 4: Include parameters in your equation and specify the data source for each.
Step 5: Input your formula equation.
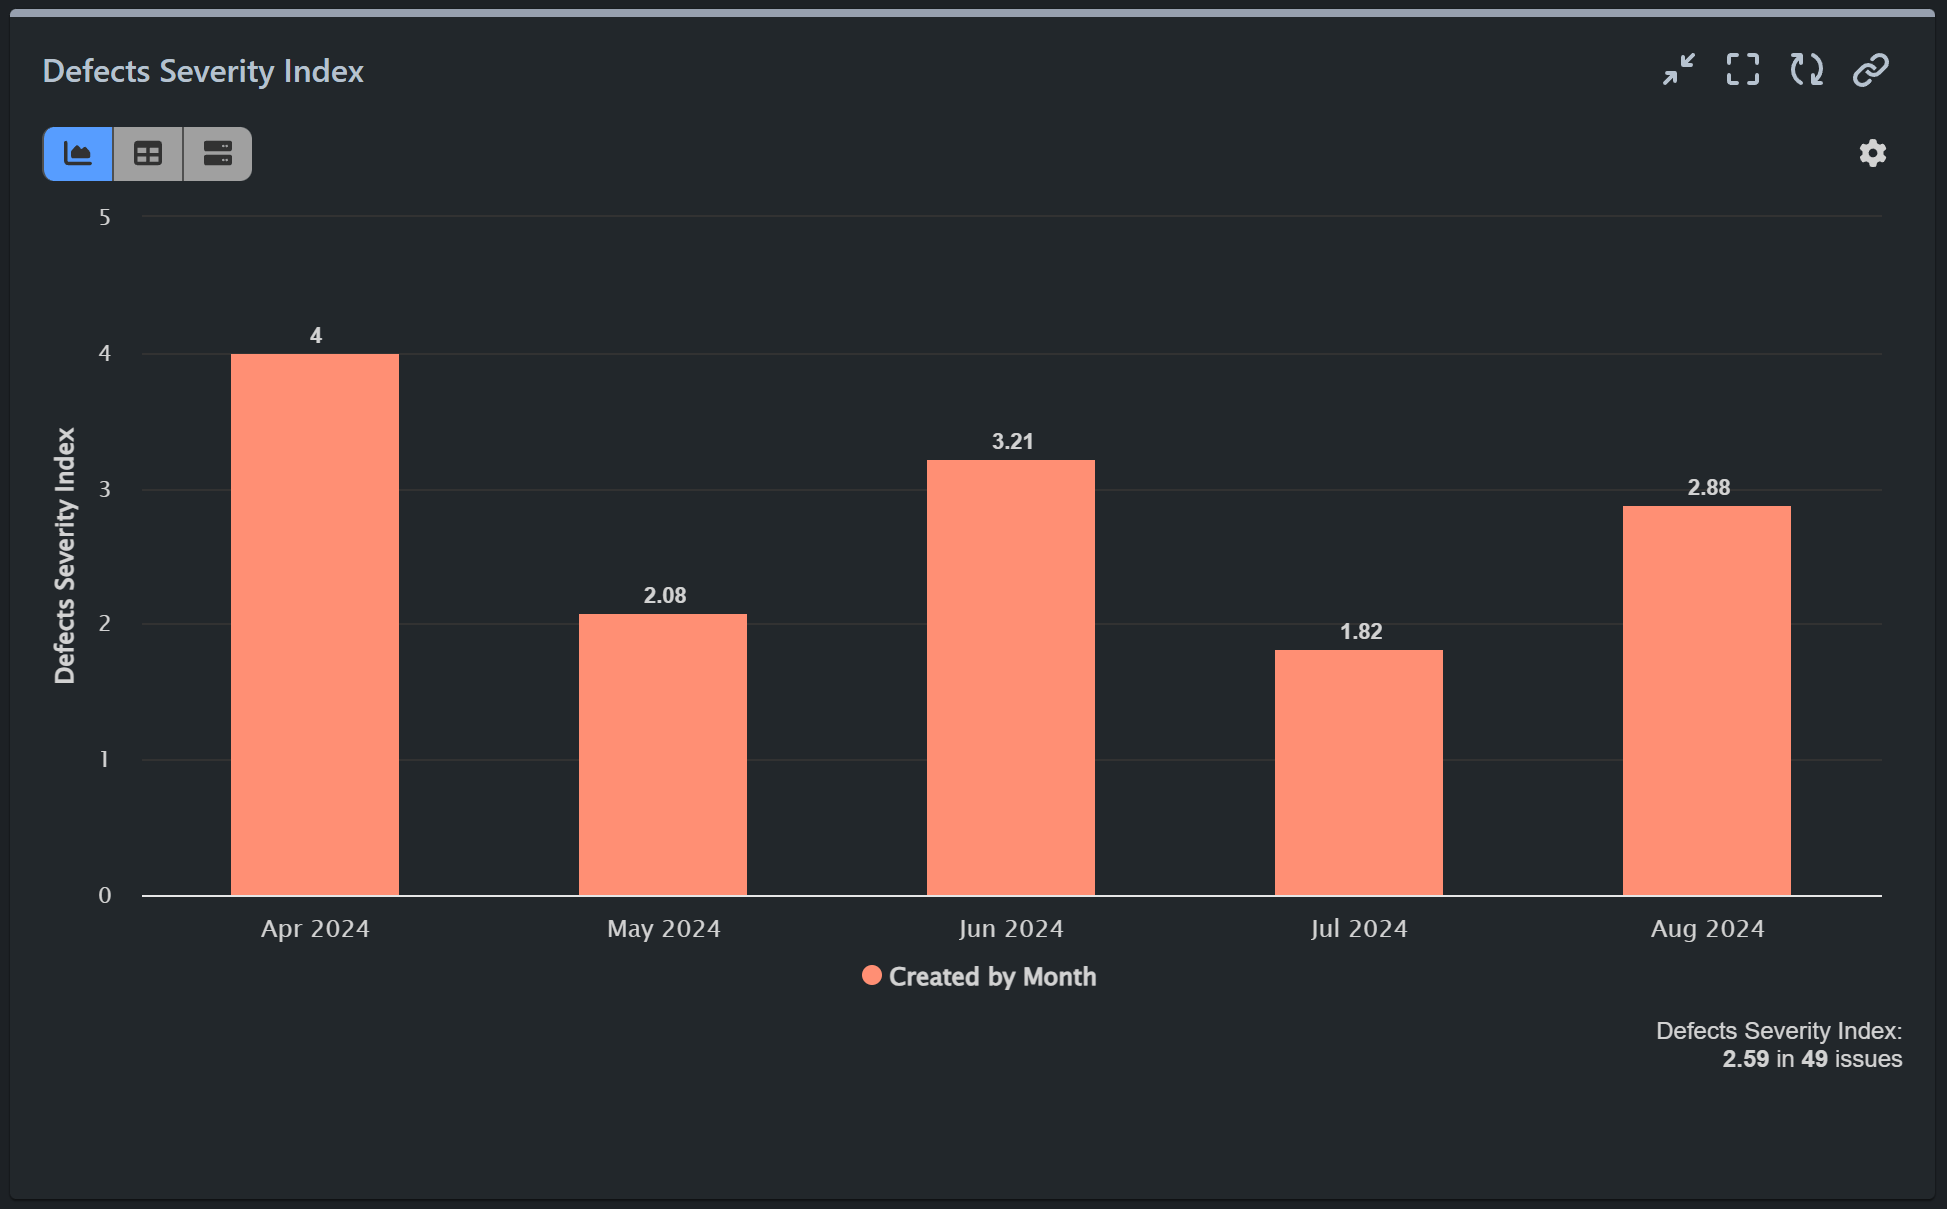
Step 6: Display by your preferred field. In our case, we use the data field ‘Created’ and specify by Month.
In our example, we have used formula metric and equation which represents a weighted calculation for bug severity during a specific time period. Each parameter of the equation (P1, P2, P3, P4) is assigned a different weight (8, 6, 3, 1, respectively), reflecting their relative importance. Thus, the “(P1*8+P2*6+P3*3+P4*1)/(P1+P2+P3+P4)” equation calculates the weighted sum of bugs across priority levels, divided by the total number of bugs.
Step 1 in detail: Utilize the Data Segmentation feature of our app to filter only “Bug” Issue Type with distinct levels of priority for each data source.
Step 4 in detail: For every metric employed as a parameter in the equation, you retain the flexibility to select the data source. In our sample scenario, we have identified four distinct data sources: Bugs with different levels of priority created within the last 120 days.
With the Performance Objectives app, you can set a benchmark for the acceptable level of defect severity within your project by utilizing the target feature. This allows you to define and monitor specific quality goals, ensuring that defect severity remains within acceptable limits and facilitating timely interventions when thresholds are breached.
Please review the comprehensive configuration steps for our sample report using the Formula feature in the following recording:
Browse our KPI Examples library or watch our video tutorials on YouTube.
Start your 30 days free trial of Performance Objectives: Charts for Jira from Atlassian Marketplace.