Table of Contents
Why Tracking the Sprint Rollover Ratio?
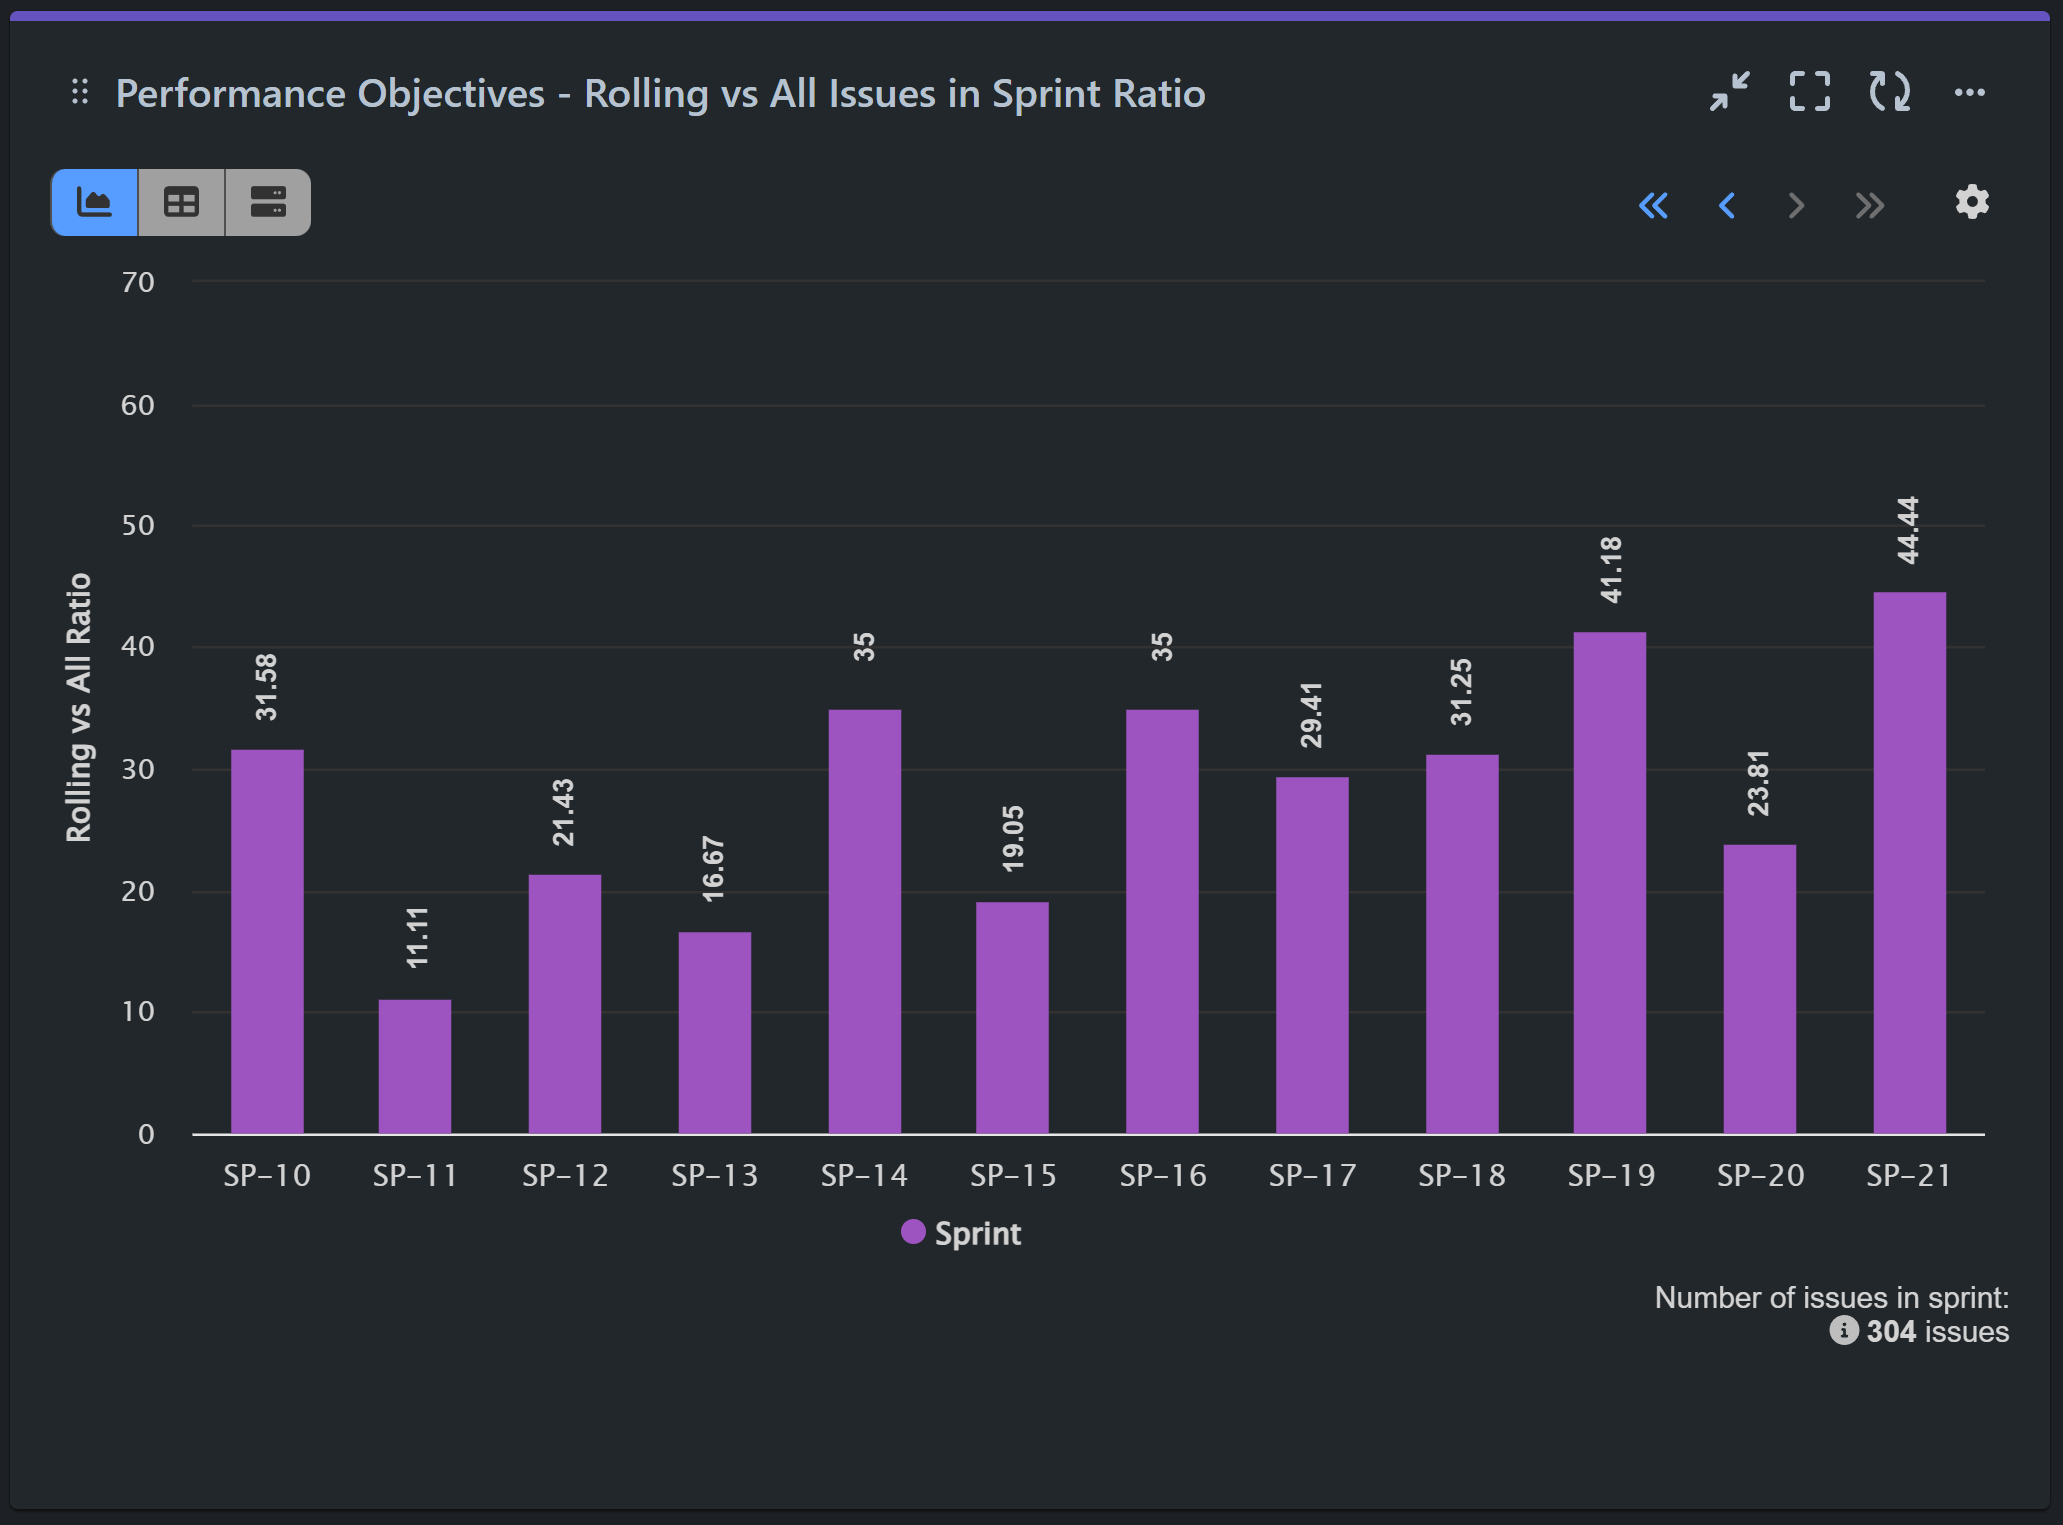
In Agile project management, keeping track of sprint efficiency is vital for continuous improvement. This article demonstrates how to build a ratio report for the number of issues rolling into a sprint versus all issues within that sprint directly on your Jira dashboard. By leveraging the Performance Objectives app’s “Number of issues in sprint” metric and its formula feature, we can calculate and display rollover ratio on a sprint-by-sprint basis. This insightful report helps teams better understand their sprint dynamics and optimize their workflow.
Analyzing Sprint Efficiency: Rolling vs All Issues in Sprint
Creating a sprint rollover ratio report provides several key benefits. First, it highlights the proportion of tasks carried over from previous sprints, enabling teams to identify recurring bottlenecks and address them proactively. Second, by visualizing this data over multiple sprints, teams can monitor their progress and make informed adjustments to improve sprint planning and execution. Additionally, this metric fosters transparency and accountability, as it clearly shows the impact of unresolved issues on current sprint goals. With the Performance Objectives app, you can easily implement this metric and gain actionable insights to enhance your team’s productivity and efficiency.

Here’s a step-by-step guide on how to configure Sprint Rollover Ratio report in Jira:
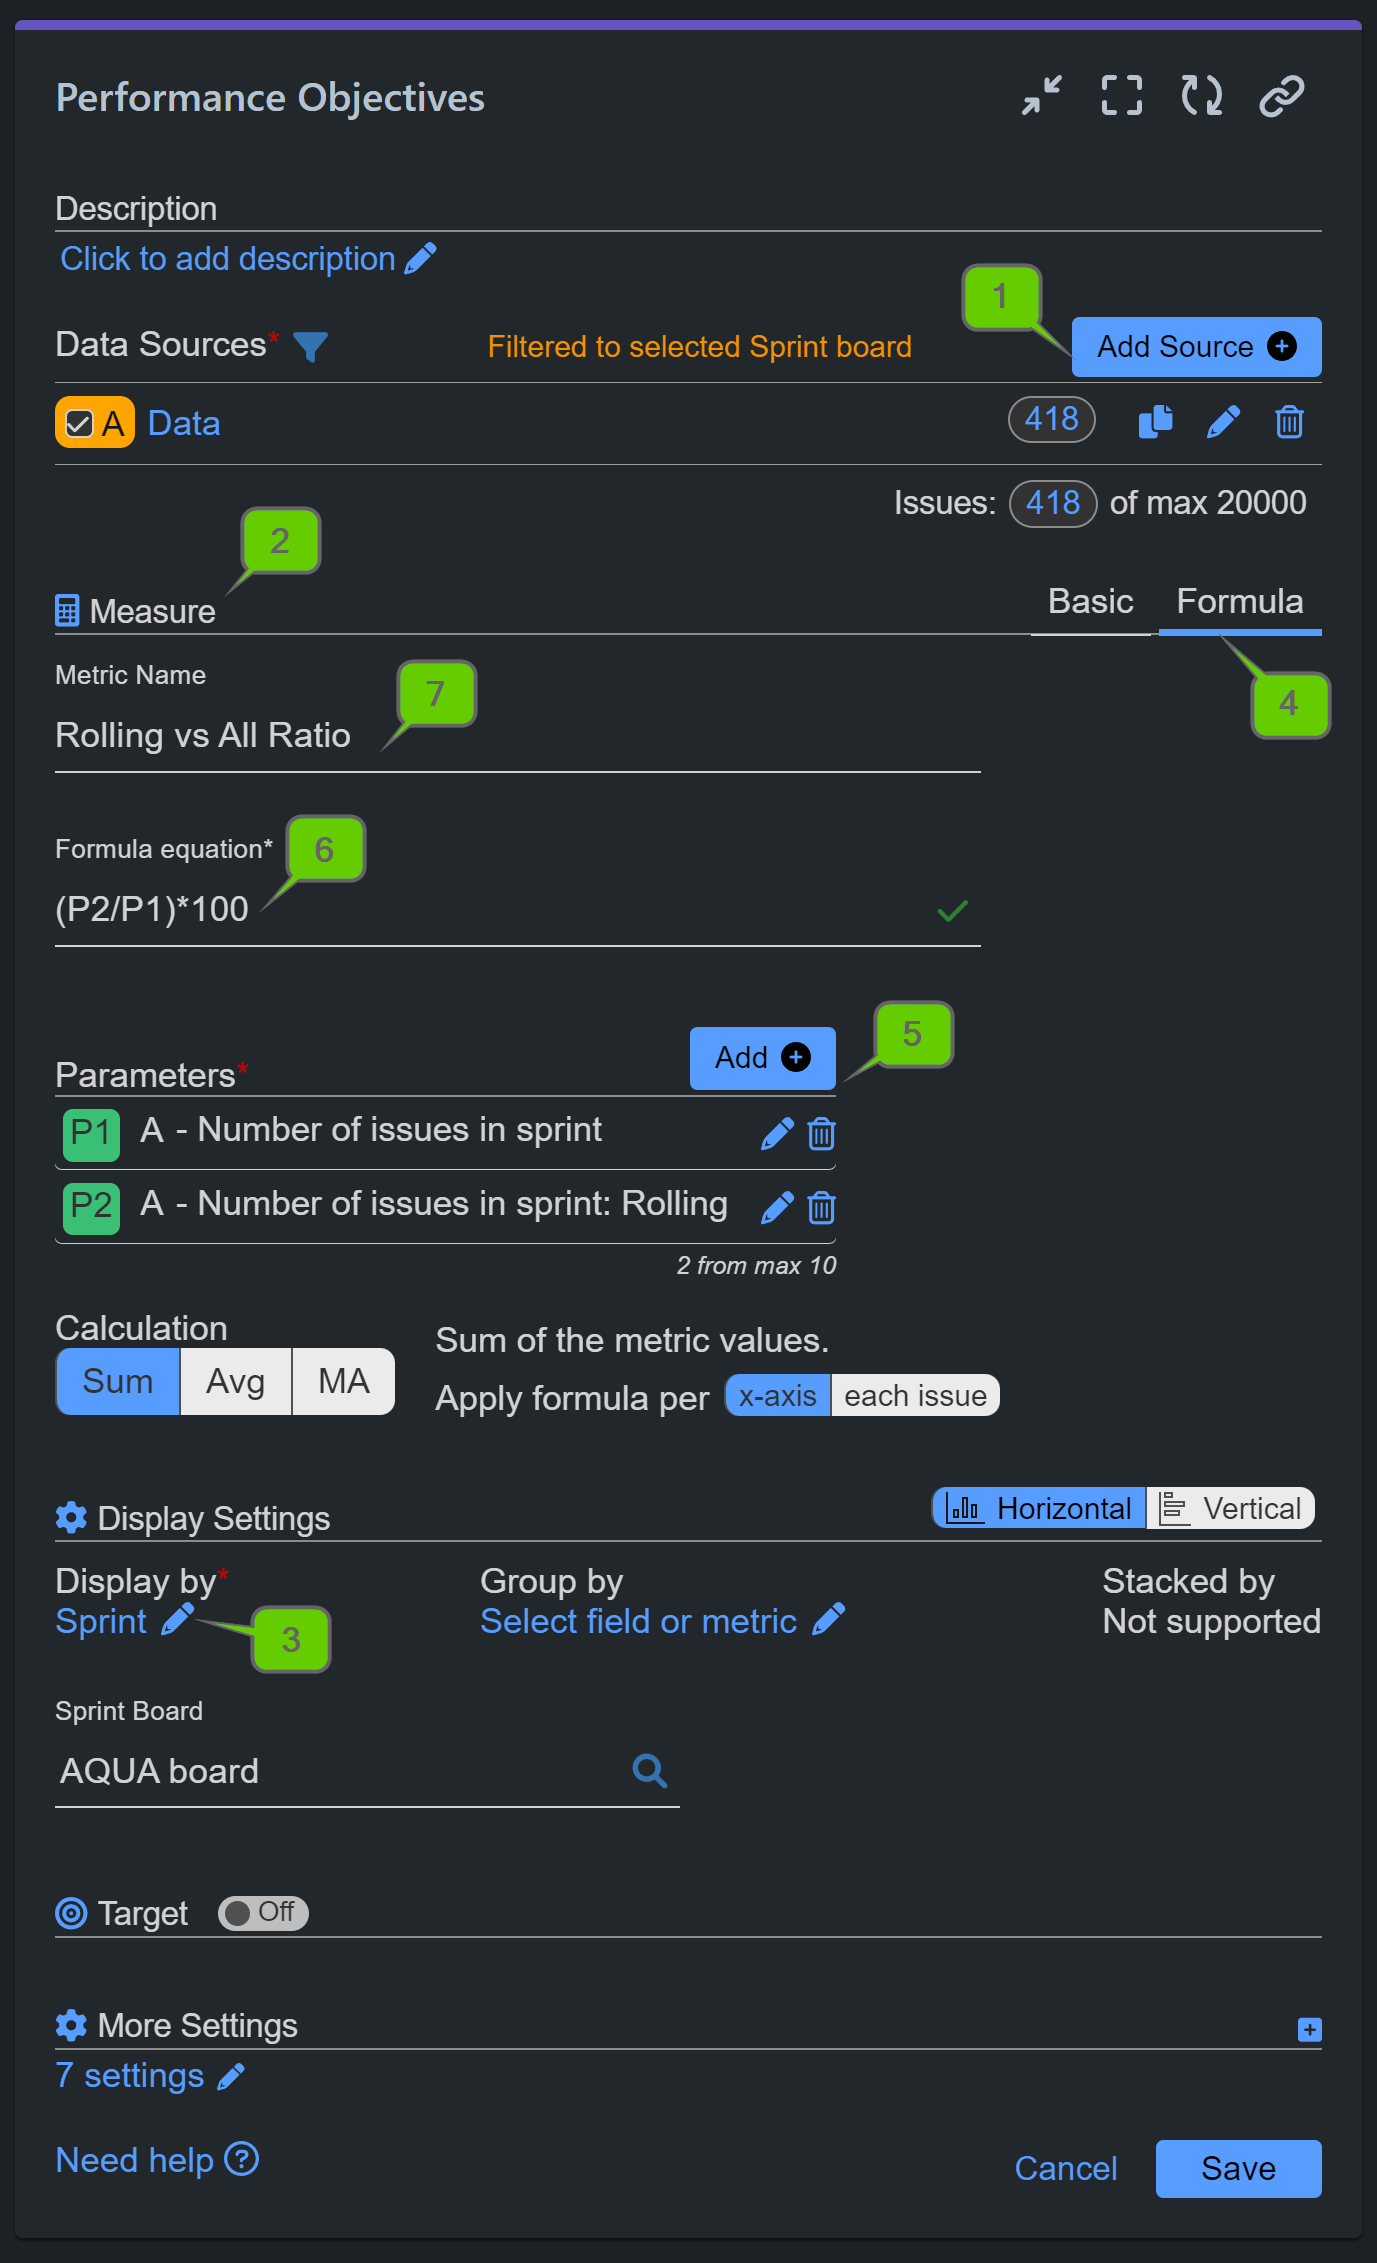
Step 1: Add Data source. In our example, we have filtered our Scrum demo project ‘Aqua’ and have disabled the date range to view all previous sprints.
Step 2: Select ‘Number of issues in Sprint‘ metric.
Step 3: Choose Sprint for ‘Display by‘ field to uncover more filtering options for your metric and add the Sprint Board you want to analyze.
Step 4: Go back to ‘Number of issues in sprint’ metric and select Formula Metric tab.
Step 5: Add two parameters for your Ratio formula. One (P1) for all issues in sprint, and the second one (P2) filtering only rolling issues in sprint.
Step 6: Add formula equation: (P2/P1)*100 to calculate the ratio in %.
Step 7: Assign a custom name to your formula metric like ‘Rolling vs All Ratio‘.

Enhance Sprint Performance: Set Maximum Target for Rolling Issues Using Our App’s Target Feature
Utilizing the powerful Target feature of our app, you can further enhance this report by adding a maximum percentage allowed for rolling issues from sprint to sprint. This will set clear performance expectations for your team and help you address potential planning and estimation accuracy issues, as well as issues related to stakeholder communication and satisfaction. Follow these steps to set a maximum target for rolling issues in a sprint, keeping them under the generally accepted healthy benchmark of 30%.
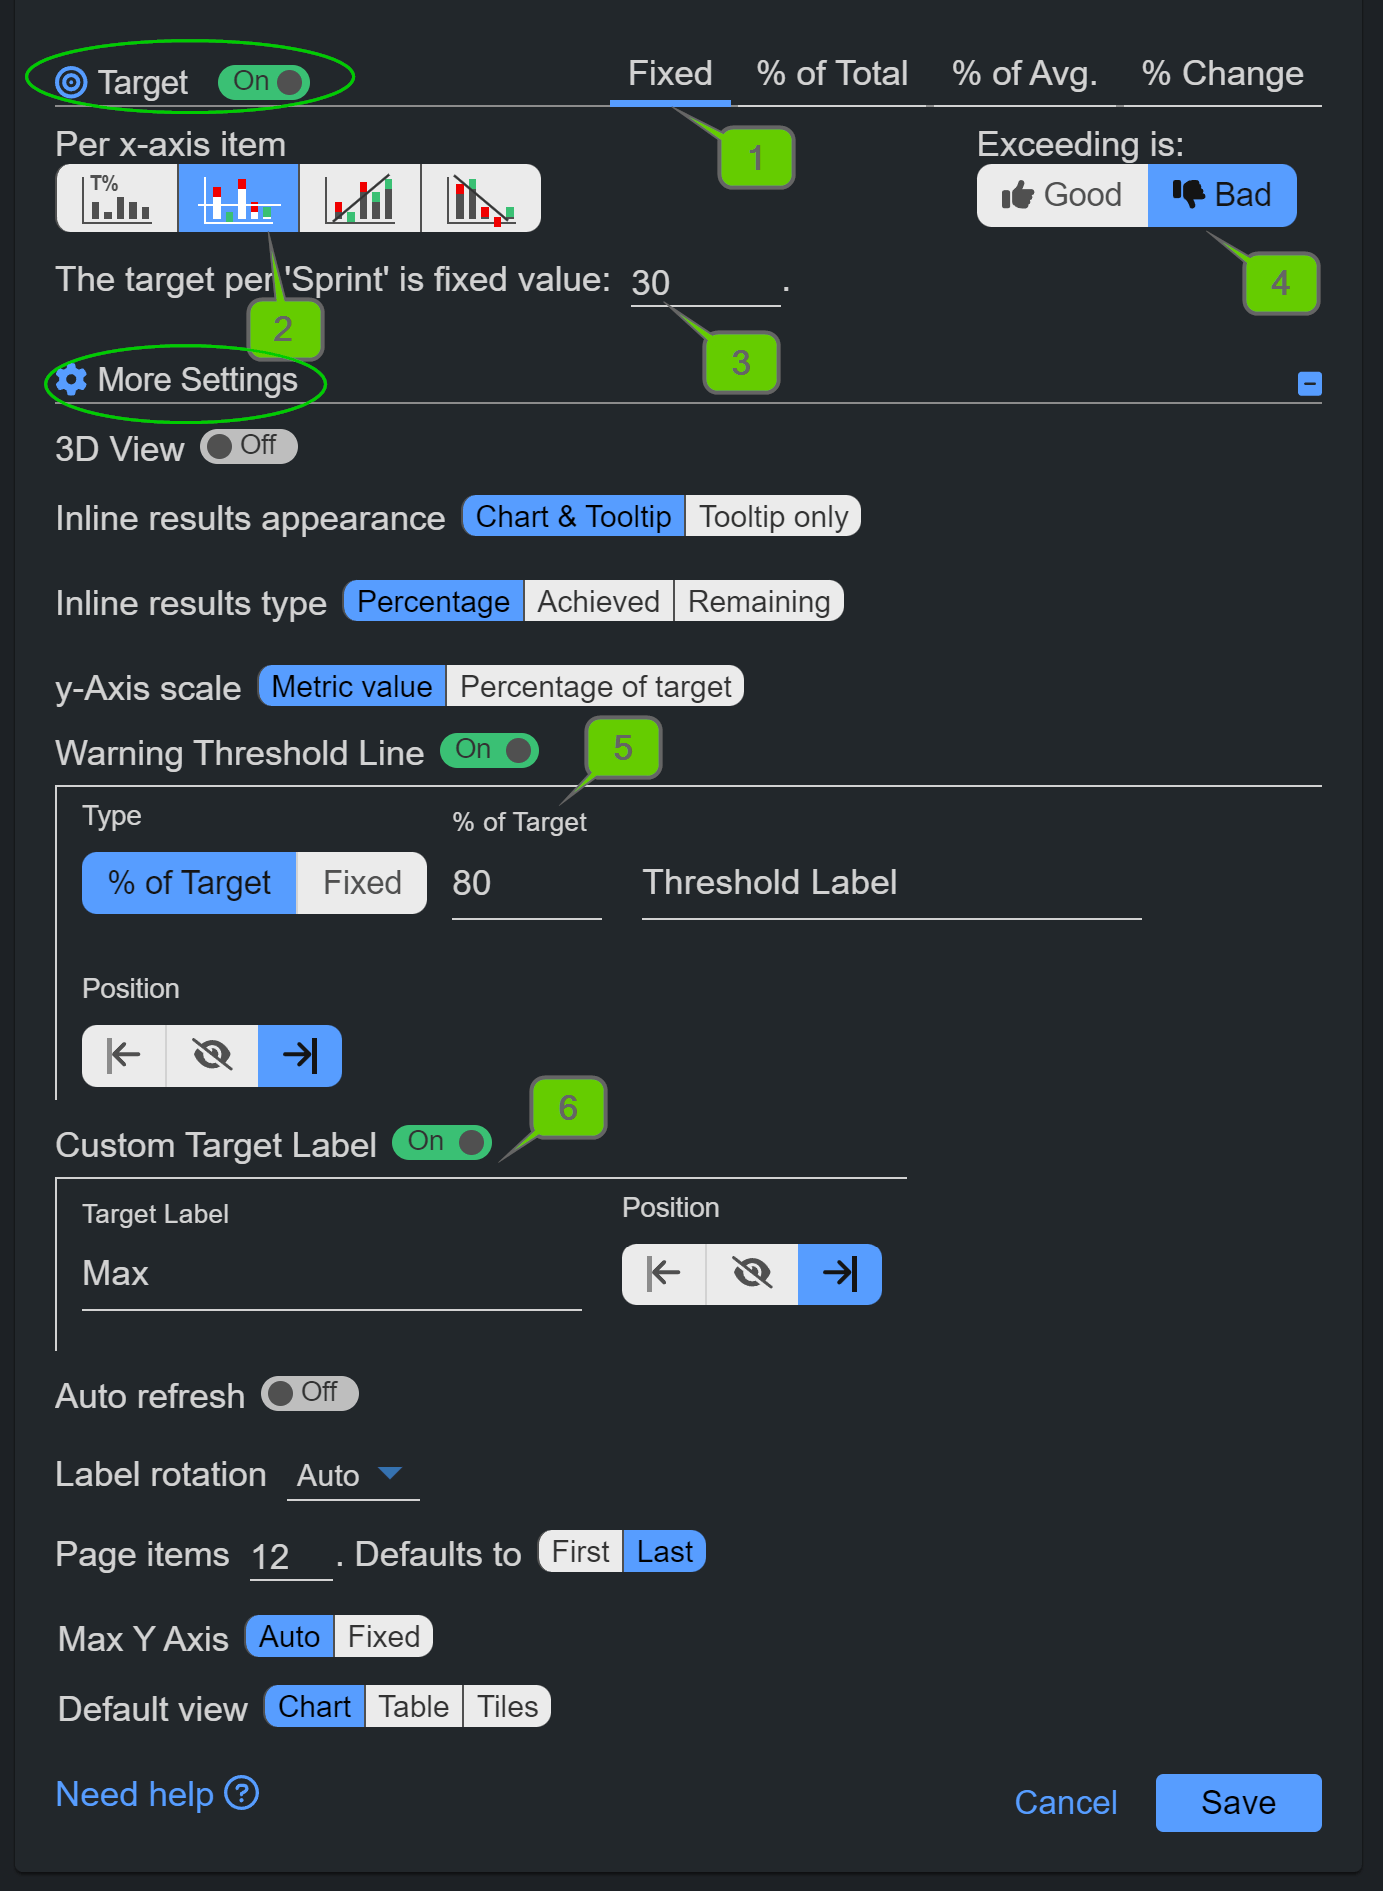
Step 1: Turn on the Target section and choose the Fixed target type.
Step 2: Select the Per x-axis item target calculation.
Step 3: Add the fixed target value. In our case, the maximum number of issues rolling from sprint to sprint is 30%.
Step 4: Specify that exceeding this maximum target is considered “Bad.”
Step 5: Under the More Settings section, add a warning threshold to signal early when approaching the maximum.
Step 6: Adjust the target label to reflect the negative aspect of exceeding the target maximum.

Watch the video recording with the configuration steps:
If you are new to our app, visit the Configuration Overview to see all app features highlighted in one place. If you are interested in sprint reports and KPI examples, visit our examples or contact our support team.
Start your 30 days free trial of Performance Objectives: Charts for Jira from Atlassian Marketplace.