Our Performance Objectives and Performance Trend gadgets come equipped with a dynamic target-setting feature, offering you a multitude of target result options to power your Jira KPI journey towards excellence. Say goodbye to the hassle of spreadsheets and other external tools – with our app, you can streamline your performance management processes right on your Jira dashboard.
Both gadgets let you compare target results with chart data through different options. Just toggle the “Target” feature in your main configuration screen, and you’re ready to explore these target result choices.
Target Results Options on Performance Objectives Gadget
Below, you’ll find a visual journey that showcases each target result option along with detailed descriptions to help you harness the full potential of this feature.
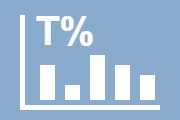
Full Metric Data
This option displays the overall percentage of target completion against the entire metric data loaded on the chart. It is the default target presentation available for all Target types.
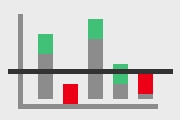
Per X-Axis Item
This option displays the percentage of completion at the top of each x-Axis item and is available for all target types.

Burn Up
This option is convenient for project planning and tracking release progress.
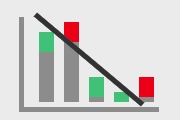
Burn Down
This option is essential for tracking budget and is a must for Scrum projects and other Agile teams’ progress..
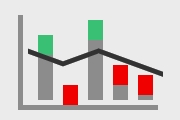
Moving Average
This option recalculates the arithmetic mean of the accumulated metric with each X-axis item and is available only for the ‘% of Avg’ target type.

Per X-Axis Item (% Change)
The same icon as the one above is used to represent ‘Per X-Axis Item’ in the ‘% Change’ target type because it aligns more closely with the expected outcome. It’s important to note that the ‘% Change’ target type does not support the ‘Moving Average’ presentation of target results.
Target Results Options on Performance Trend Gadget
Now, let’s explore the different target result options available in the Performance Trend Gadget.
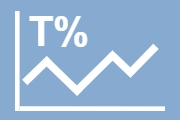
Full Metric Data
This option displays the overall percentage of target completion against the entire metric data loaded on the Performance Trend gadget chart. It is the default target presentation available for all Target types.
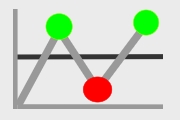
Per X-Axis Item
Displays the completion percentage at the top of each X-Axis item on the Performance Trend gadget.

Burn Up
A convenient option for project planning and tracking release progress on the Performance Trend gadget.

Burn Down
A useful option for tracking budget or Agile sprint progress on the Performance Trend gadget.

Moving Average
This option recalculates the arithmetic mean of the accumulated metric with each X-axis item and is available exclusively for the ‘% of Avg’ target type.

Per X-Axis Item (% Change)
The same icon as above is used to present ‘Per X-axis item’ in ‘% Change’ because it aligns more closely with the expected outcome. Please note that the ‘% Change’ target type does not support the ‘Moving Average’ presentation of target results.
Customize Your Result Display
We understand that how one perceives surpassing a target can vary depending on the target’s specific definition. That’s precisely why we provide the flexibility of our result display feature. With this feature, you can decide whether to present your accomplishments positively in green or negatively in alerting red on the chart.


Exceeding the target is “Good”
This is the default target result presentation. Exceeding the target is considered a positive outcome.
e.g.
At least 80% of support requests have a First Response Time < 8 hours
- Target = 80%, exceeding is good. ????
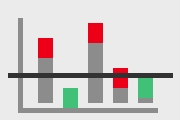
Exceeding the target is “Bad”
For example, let’s take a target related to the maximum acceptable time for the first response or the maximum allowable number of defects. Exceeding this target is deemed undesirable and should be classified as a ‘negative’ outcome.
e.g.
Maximum 20% of support requests have a First Response Time > 8 hours.
- Target = 20%, exceeding is bad. ????
For more information on Target types, please explore our User guide or refer to our KPI examples.
Start your 30 days free trial of Performance Objectives: Charts for Jira from Atlassian Marketplace.

