Performance Objectives and Performance Trend gadgets are essential tools for goal-setting, performance measurement, and tracking KPIs, as they support Target calculation feature. One standout customization option of the app is its ability to easily adjust inline target result formatting directly on your Jira dashboard. With three formatting options to choose from, you can present your Jira data according to your unique reporting needs.
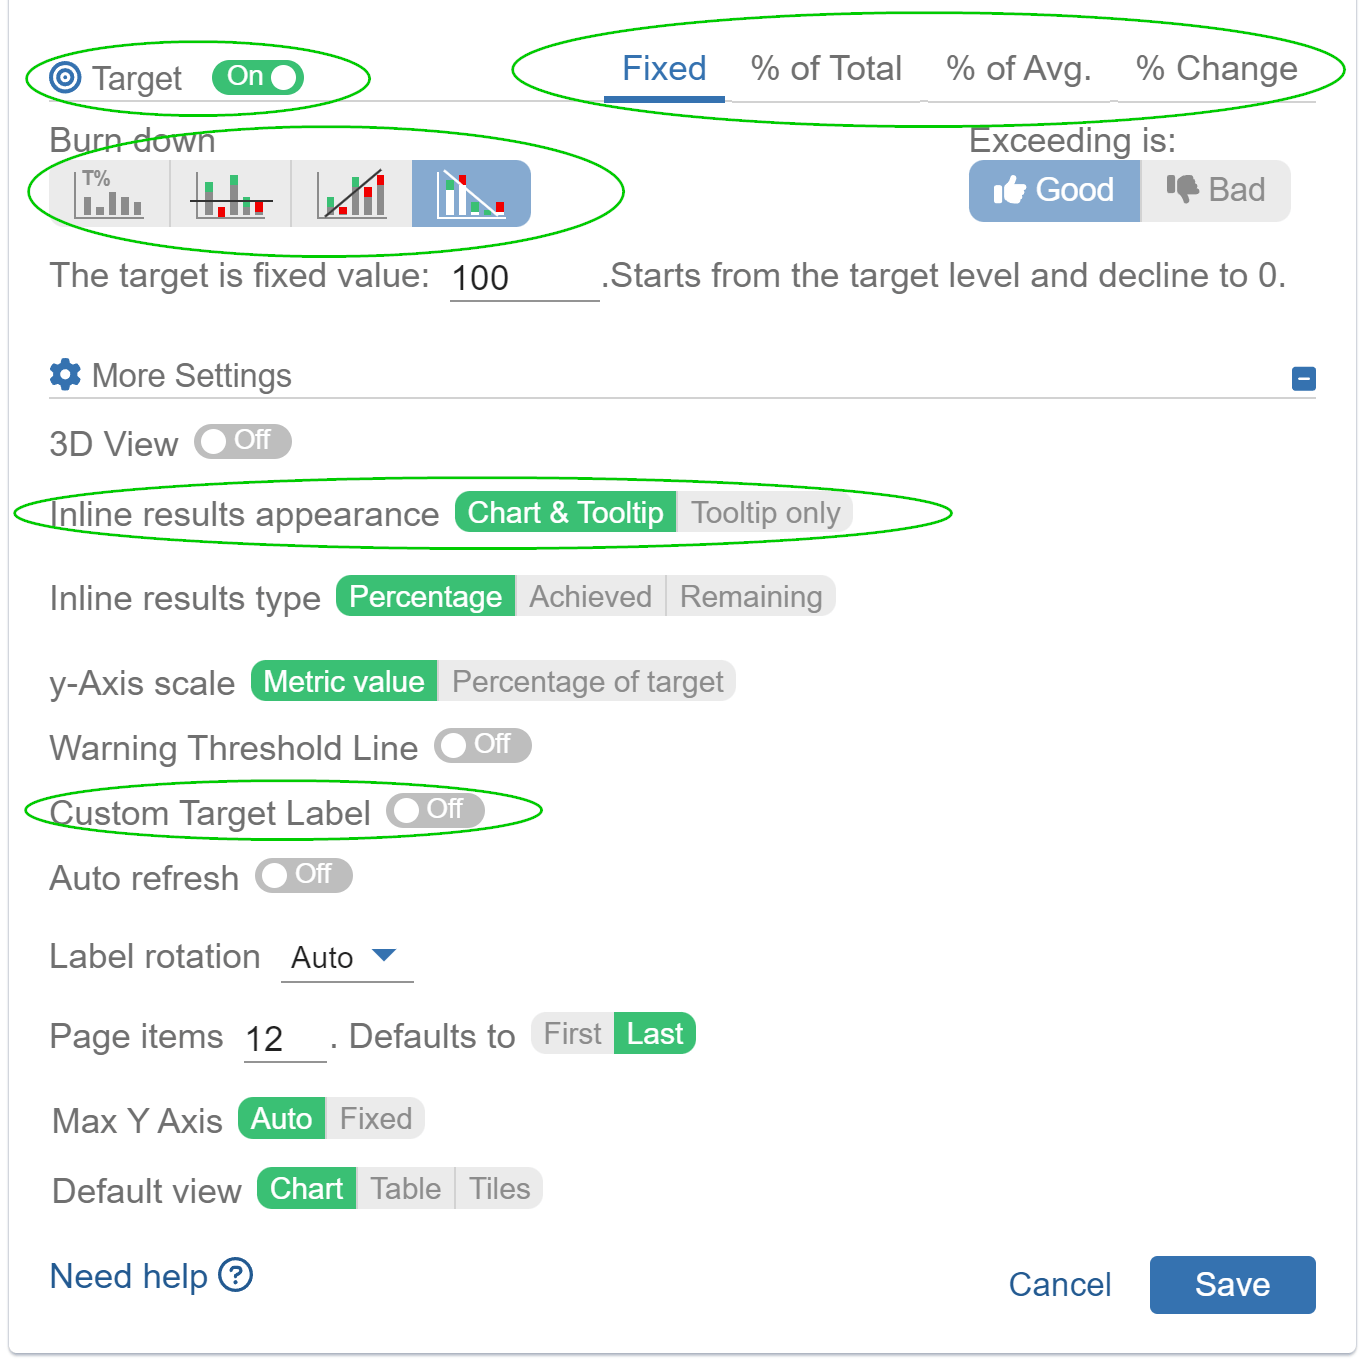
To access this feature, simply enable Target calculations on the main configuration screen of the gadget. Next, select from the options of Target Per x-axis item, Burn up, or Burn Down target visualizations. Further customization can be done under More Settings, specifically in the Inline Results type section. Here, you can opt for Percentage, Achieved, or Remaining as your desired target result formatting.

Let’s explore various visualizations using the three target result formatting options:
Target Results as Percentage

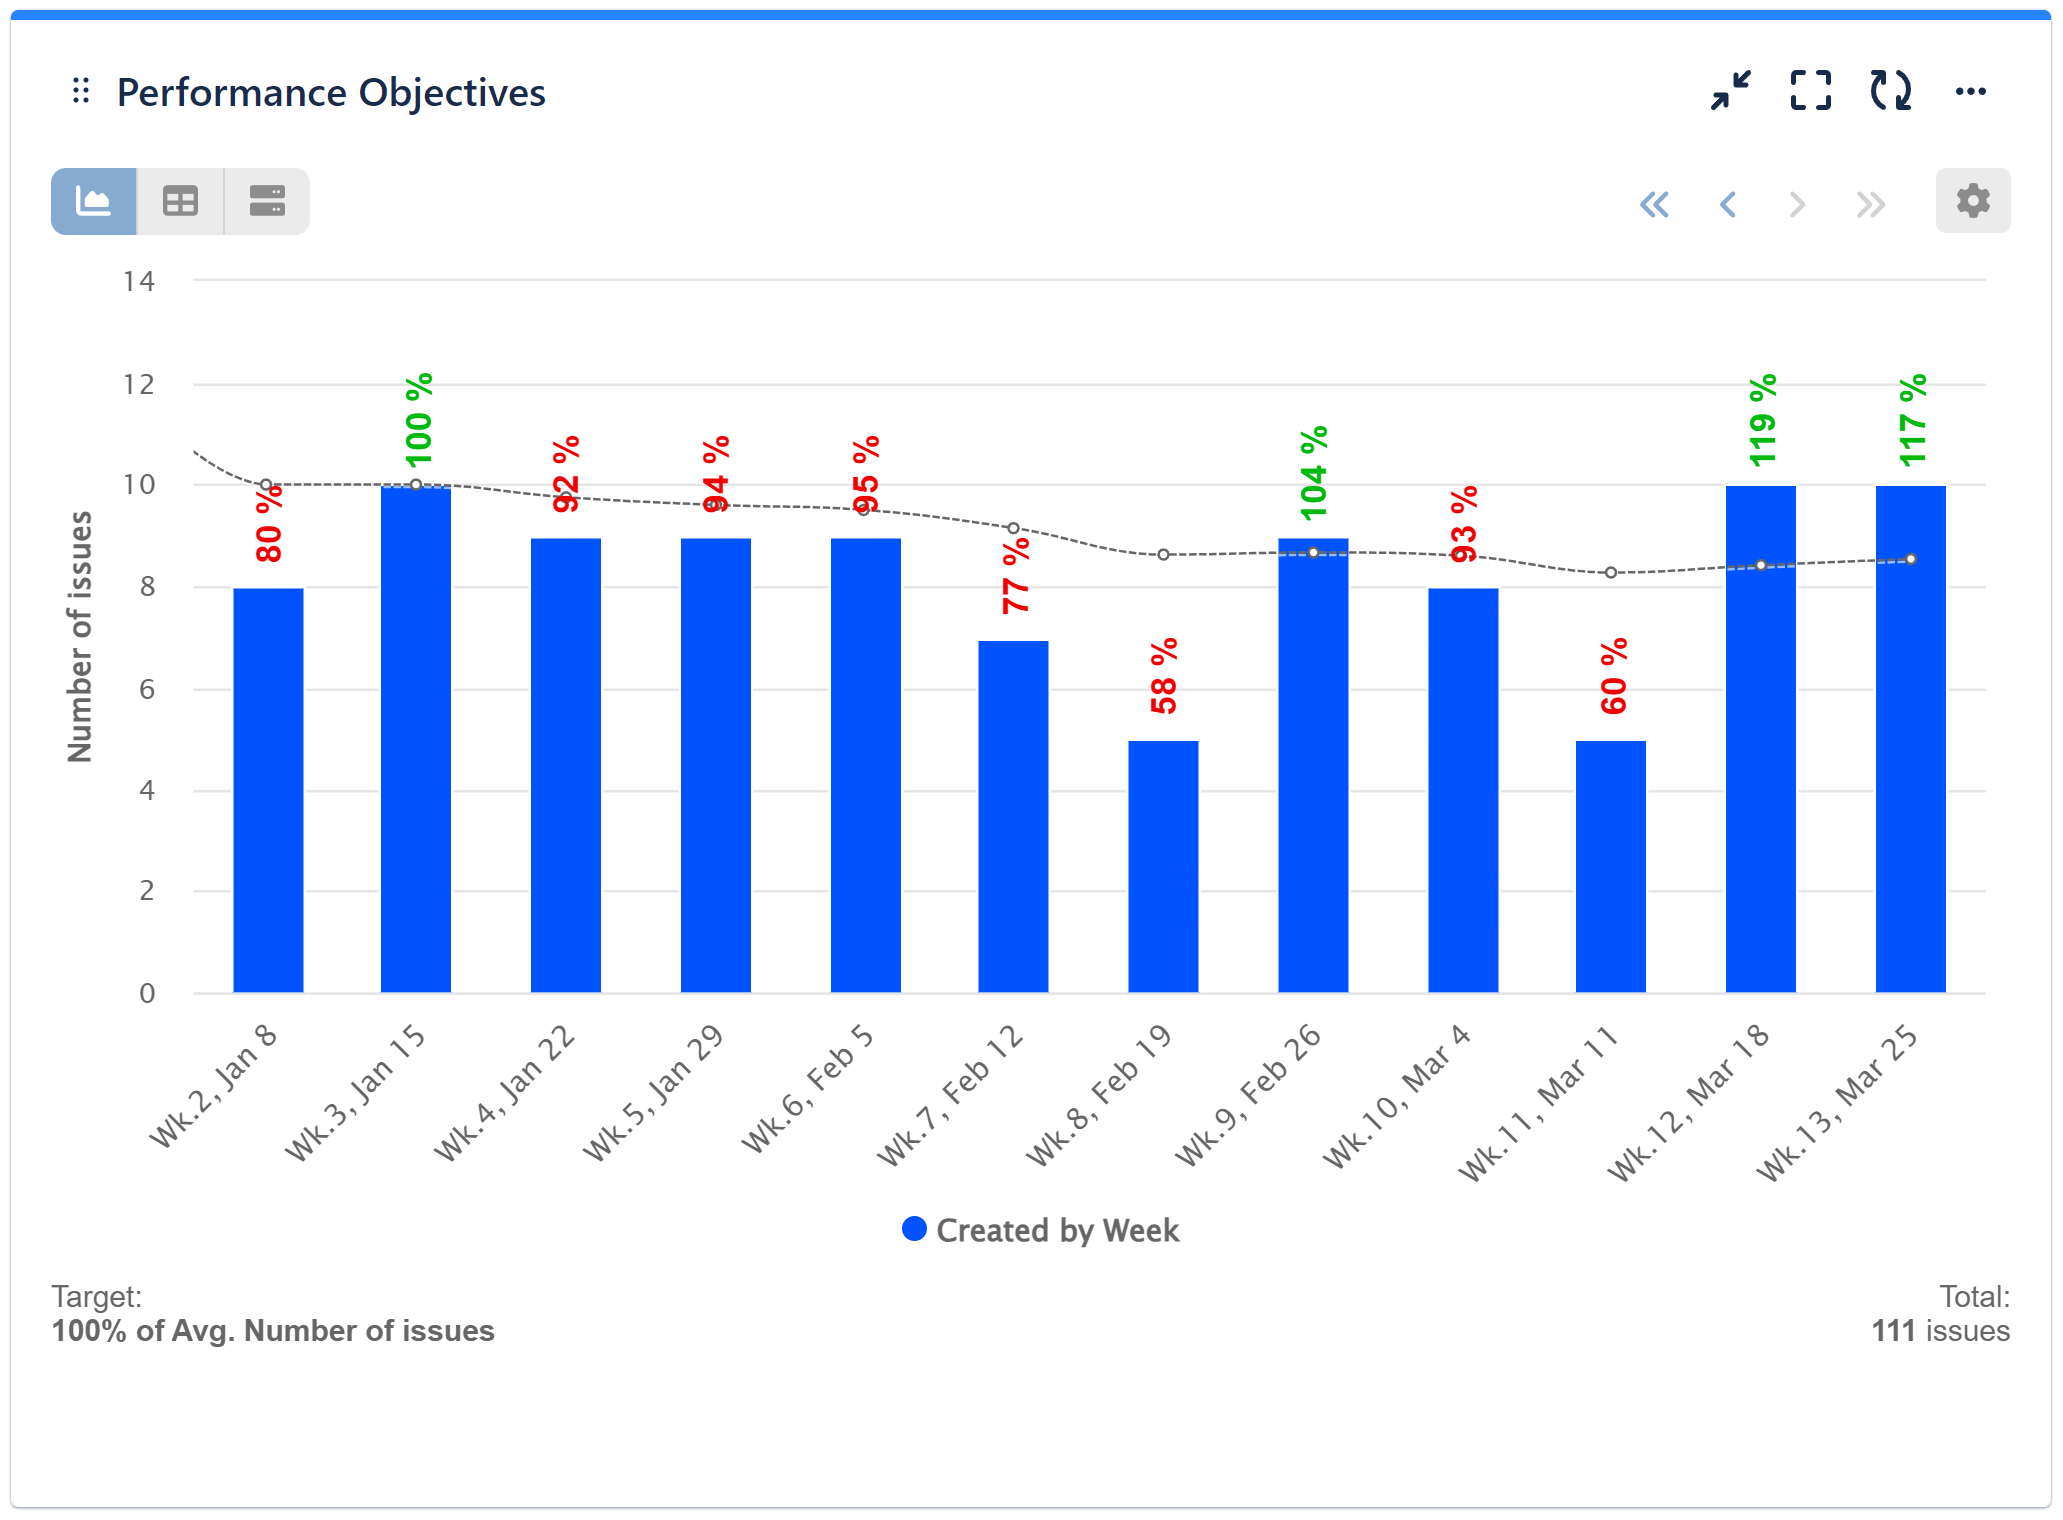
In this chart, we’ve employed the Inline result formatting type as “Percentage.” This chart showcases the number of issues created per week, displaying individual results for each distinct week. These results are contrasted against a target of 100%, derived from the Moving Average of issues created throughout the defined period specified in the Data Source.

Target Results as Achieved

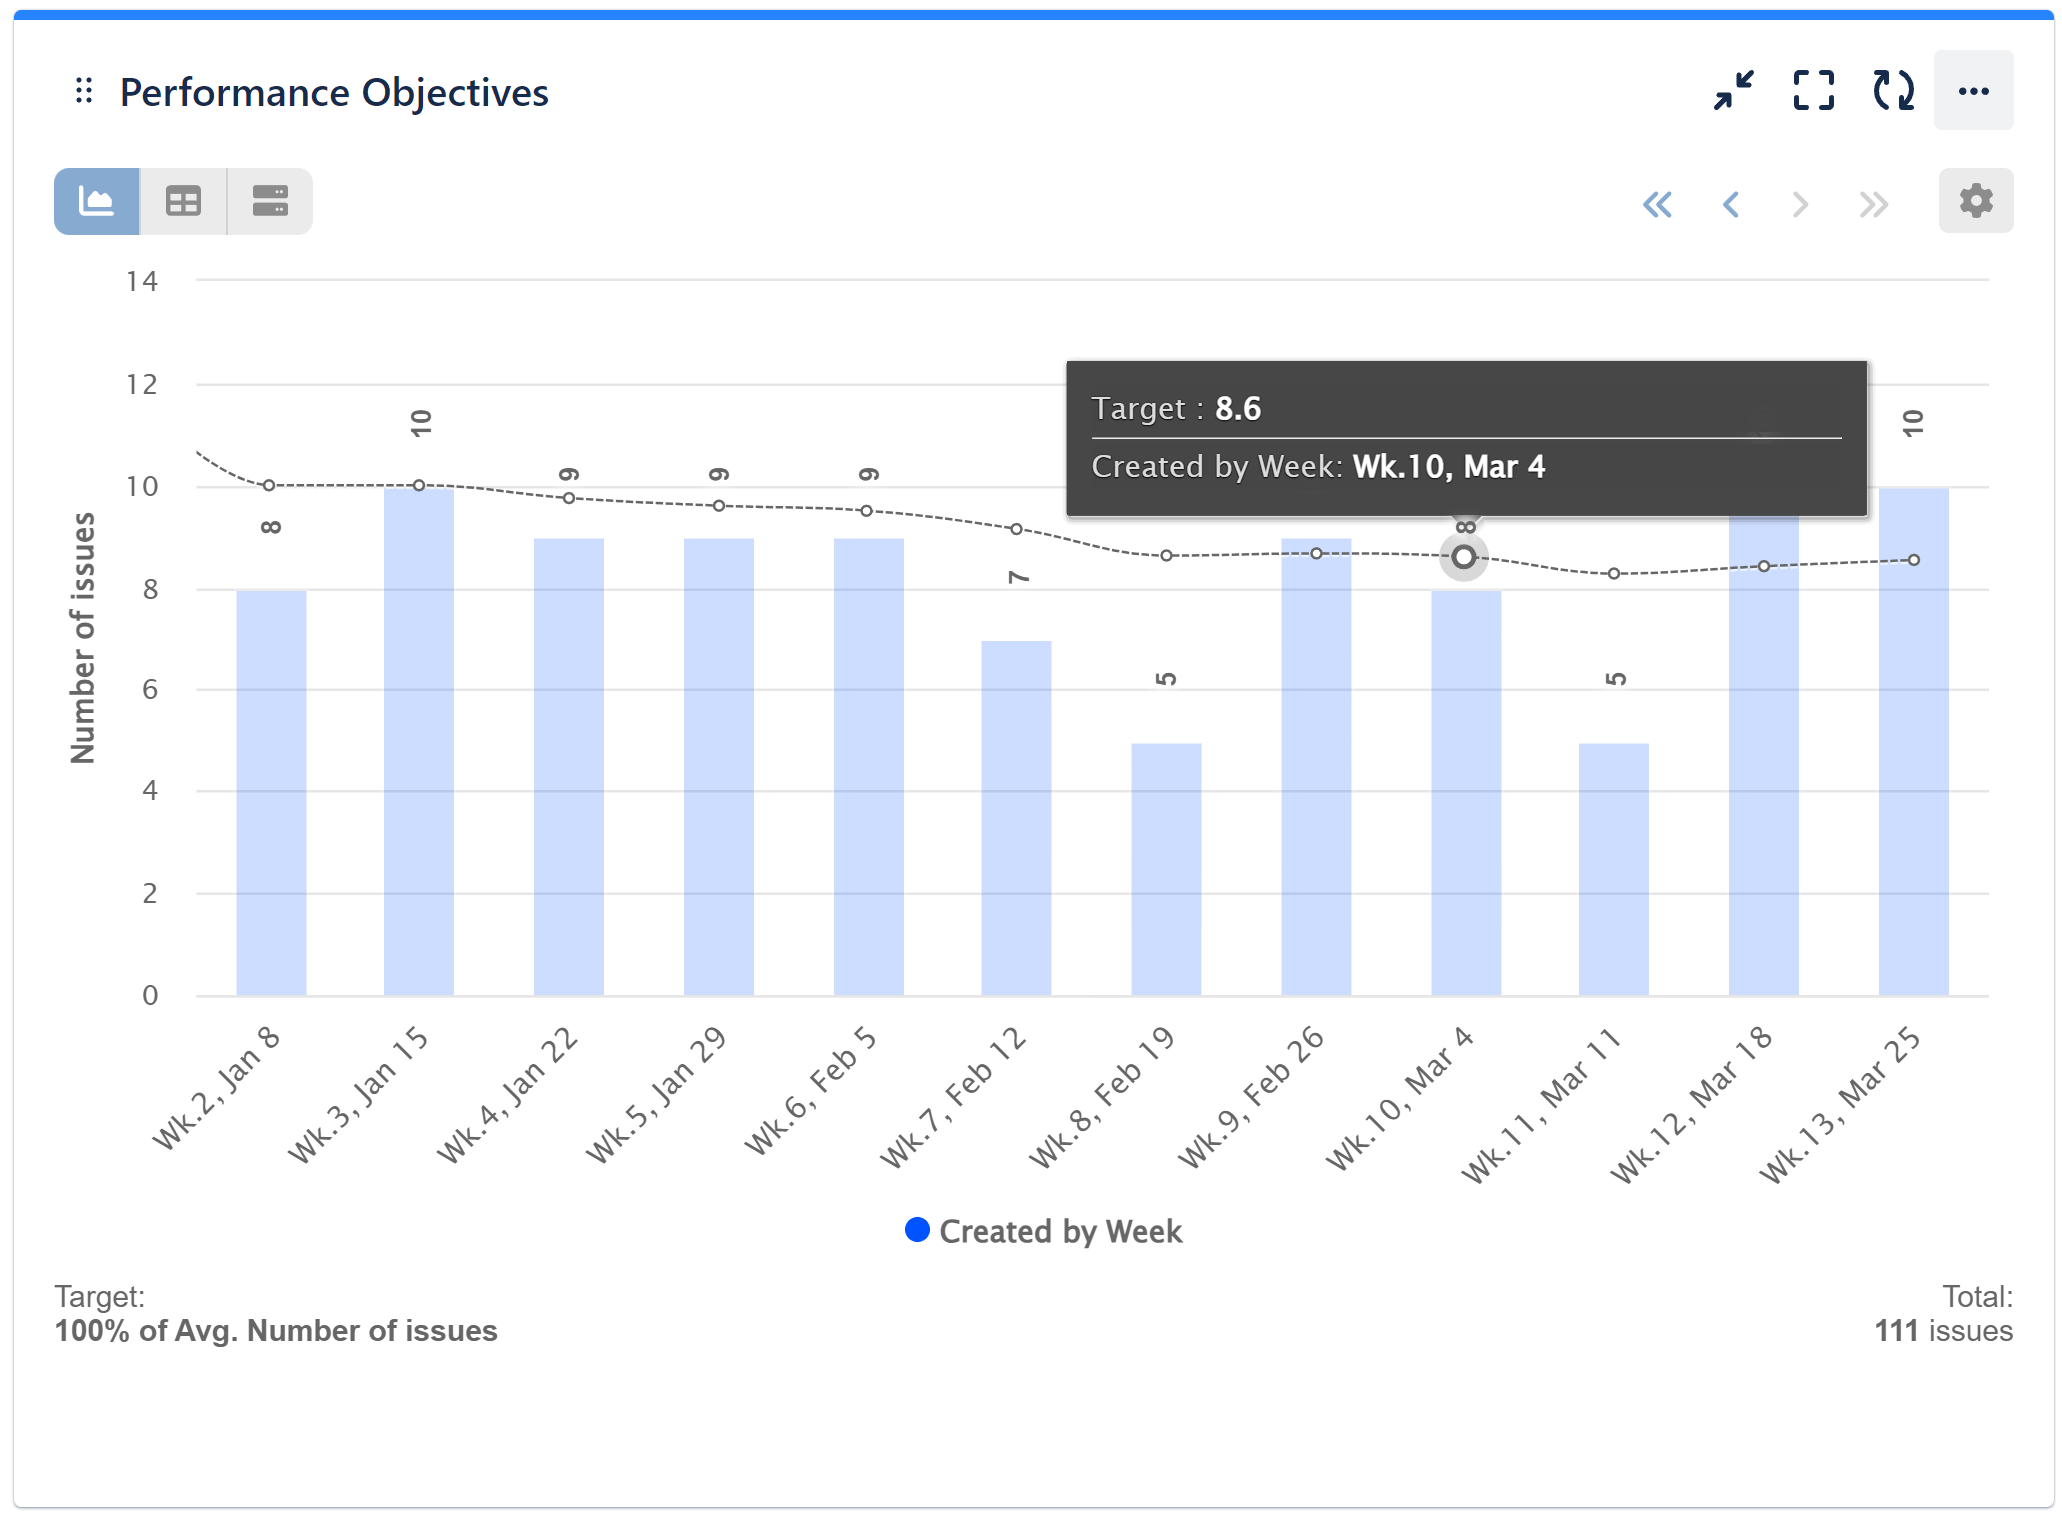
In this chart, we’ve employed the Inline result formatting type as “Achieved.” When you hover over the target line on the chart, a tooltip will provide you with precise information about the number of issues that constitute the target for each specific week.

Target Results as Remaining

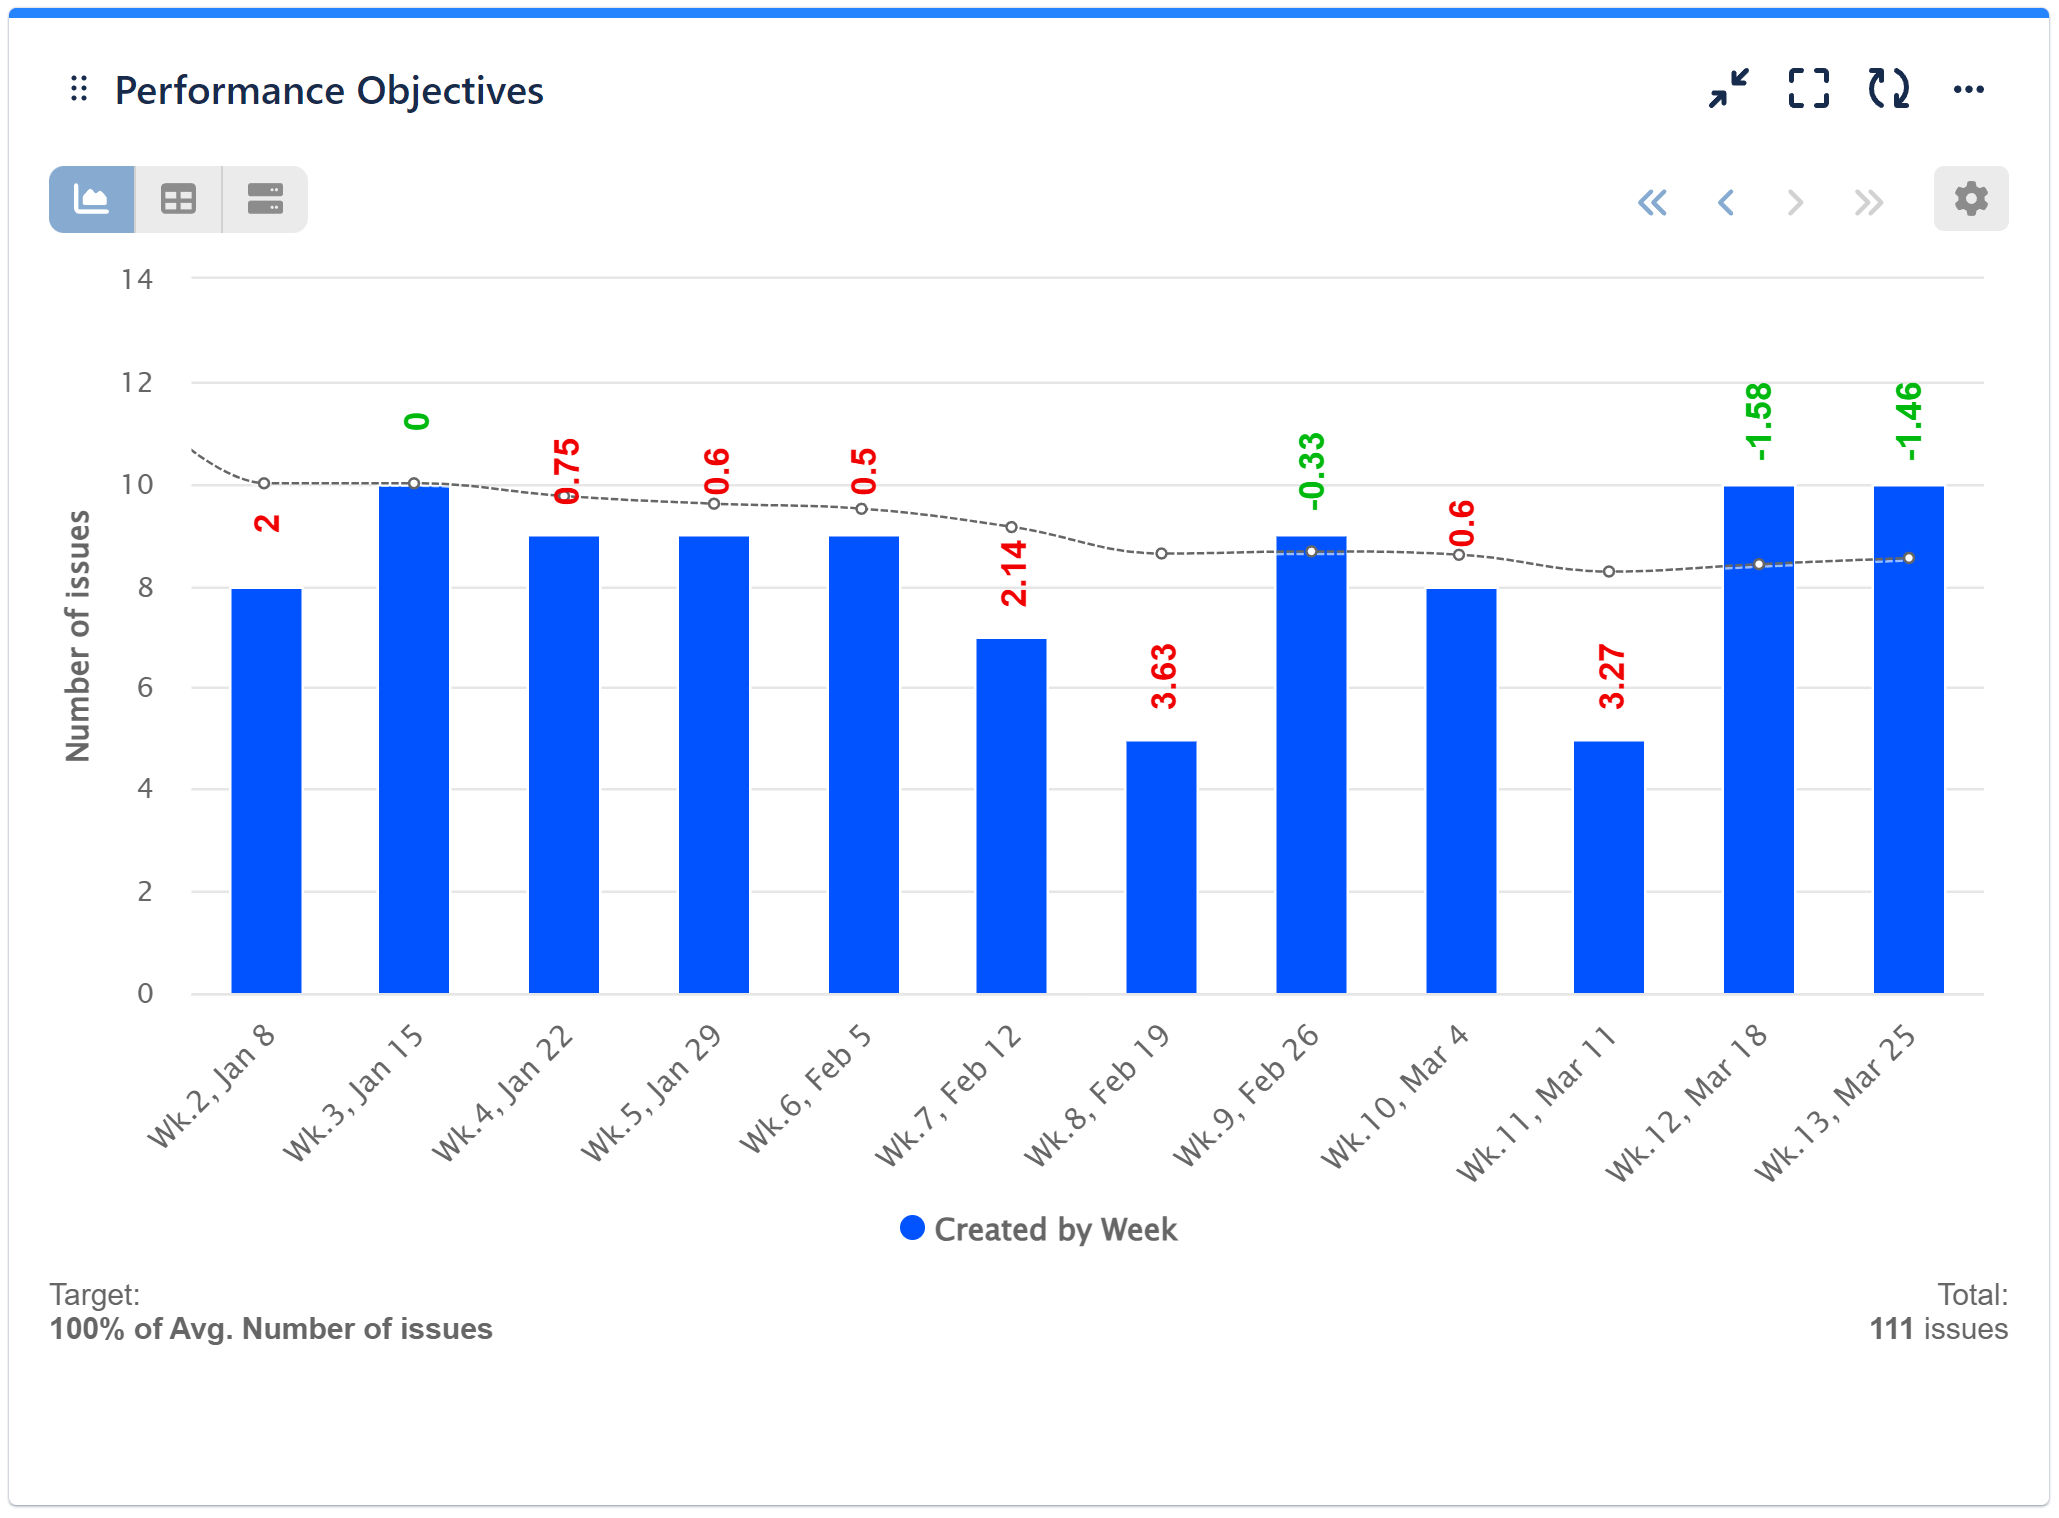
In this chart, we’ve employed the Inline result formatting type as “Remaining” This formatting choice offers a visualization of the extent by which your team has fallen short of their target.

Explore our comprehensive articles on Target types, Target Results, Target Label Liaising to gain valuable insights into optimizing your performance management process and enhancing your experience directly on your Jira dashboard.
To discover the app’s different features, check out the Configuration Overview.
Start your 30 days free trial of Performance Objectives: Charts for Jira from Atlassian Marketplace.