Table of Contents
The Vital Role of Tracking Cycle Time vs Lead Time in Jira
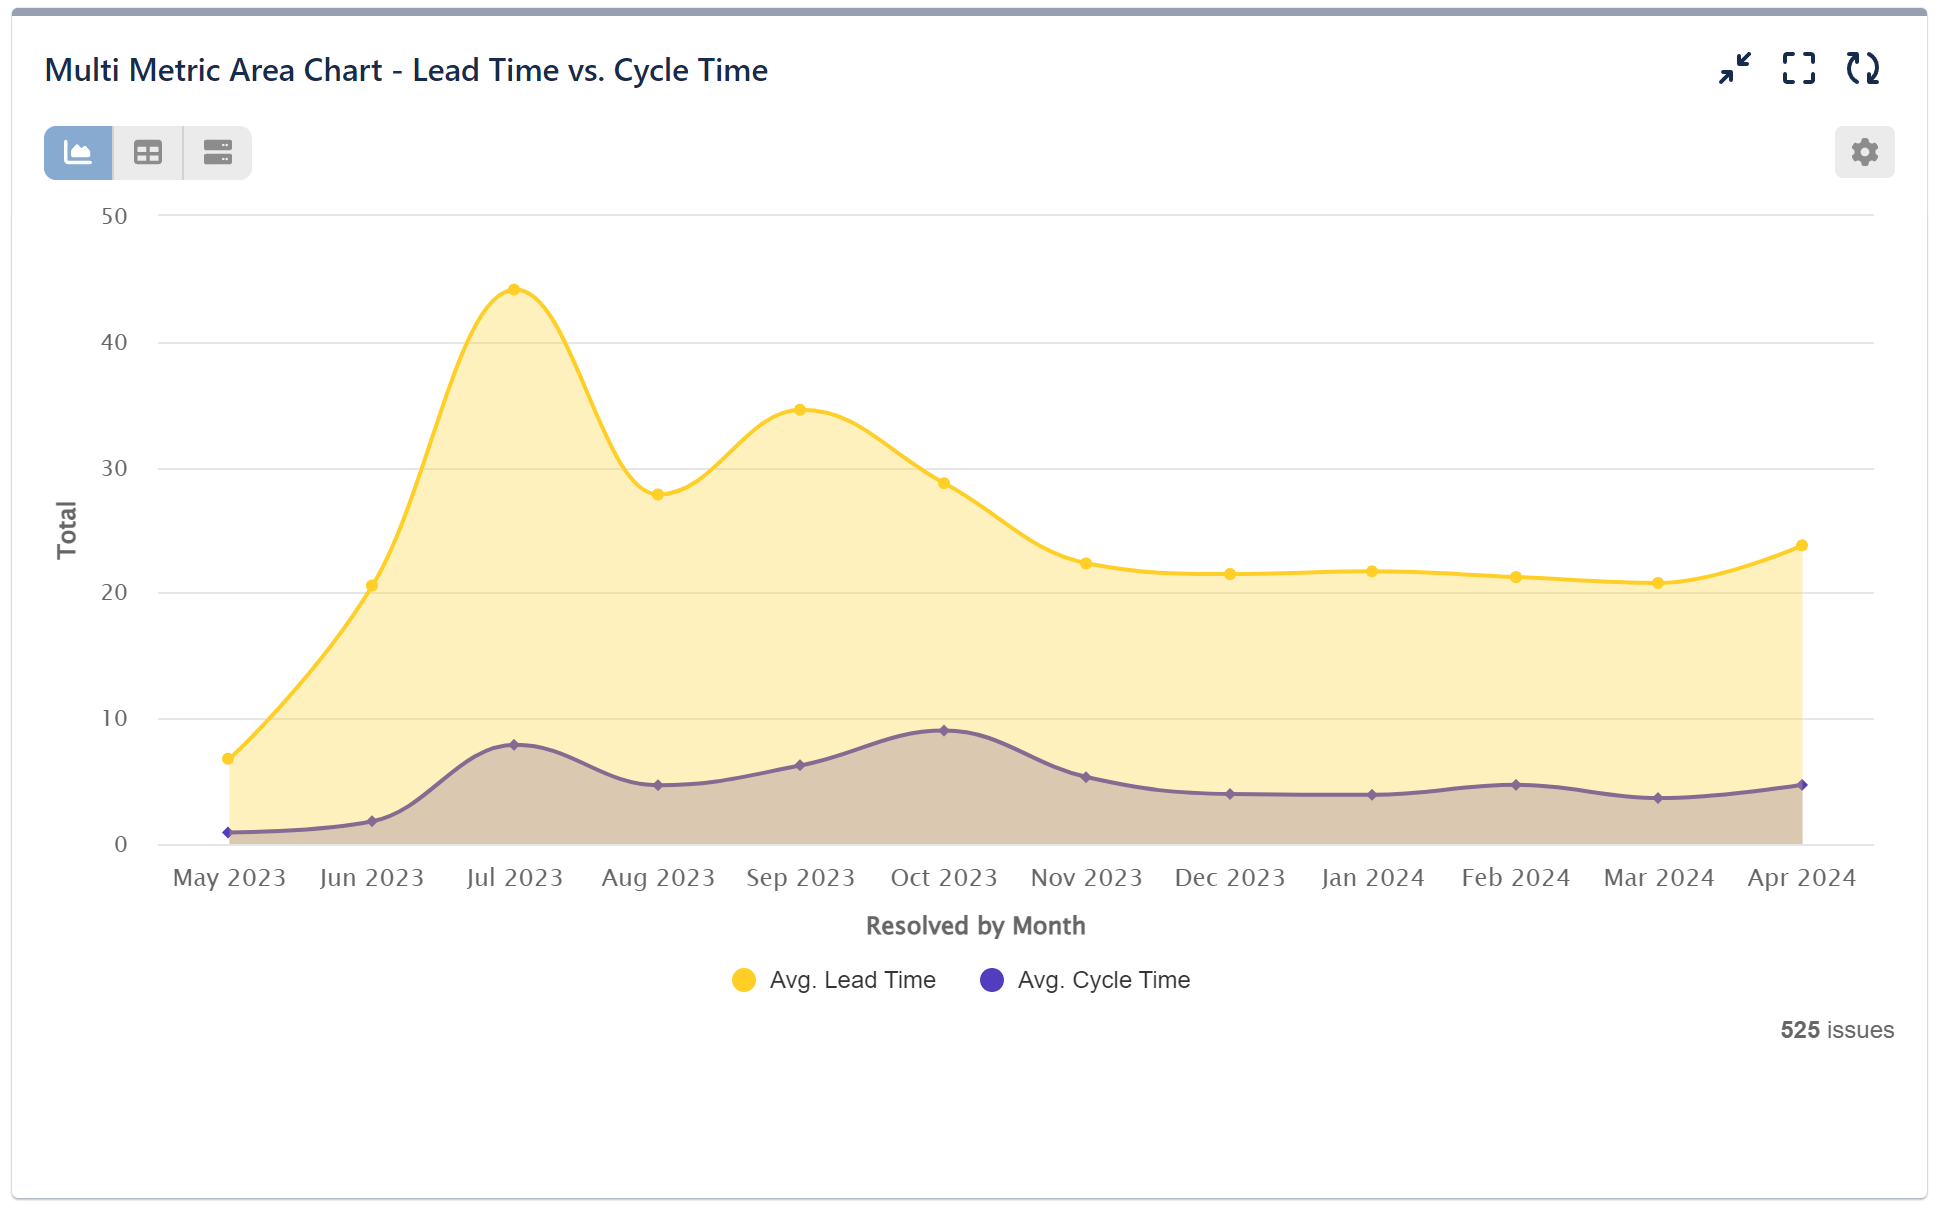
Lead time and cycle time are key project performance metrics that provide valuable insights into how efficiently work is being completed.
- Lead time measures the total time taken from the creation of a task to its completion (from “Created” to “Resolved”).
- Cycle time measures the time it takes to complete a task once work has begun (from “In Progress” to “Resolved”).
Understanding lead time and cycle time is essential for teams to optimize their workflow. By analyzing these metrics, teams can pinpoint bottlenecks, delays, or inefficiencies in their processes. This analysis enables them to allocate resources more effectively, and enhance overall productivity. Tracking both metrics also allows teams to predict how long similar tasks will take to complete in the future. Shorter lead times result in faster delivery of products or services to customers, leading to higher satisfaction levels. Therefore, monitoring lead time and cycle time in Jira is crucial for teams to ensure timely delivery and meet customer expectations.
Let’s see how we can use our app’s Multi Metric Trend or Multi Metric Combined gadgets along with the dynamic metric ‘Time Between‘, conditional expressions and average calculations to create powerful Jira KPI report comparing both metrics on a single chart.
Tracking Lead Time vs Cycle Time Averages with Multiple Metrics Gadgets for Insightful Jira KPI Reports
In our Jira data analysis, we may boost our insights by using gadgets that handle multiple metrics. By combining multiple metrics on a single chart we aim to craft a detailed Jira KPI report that tracks both cycle and lead time effectively. This approach enables us to gain deeper understanding of our project performance and make informed decisions regarding its efficiency.
Averages help smooth out fluctuations and variability in individual data points, providing a clearer picture of overall performance trends. This can be particularly helpful in scenarios where there are occasional outliers or spikes in cycle or lead time, which may not accurately represent the typical workflow.
We’ve also leveraged the Conditional feature in our sample scenario to assign custom names to the two metrics, reflecting their specific purposes.
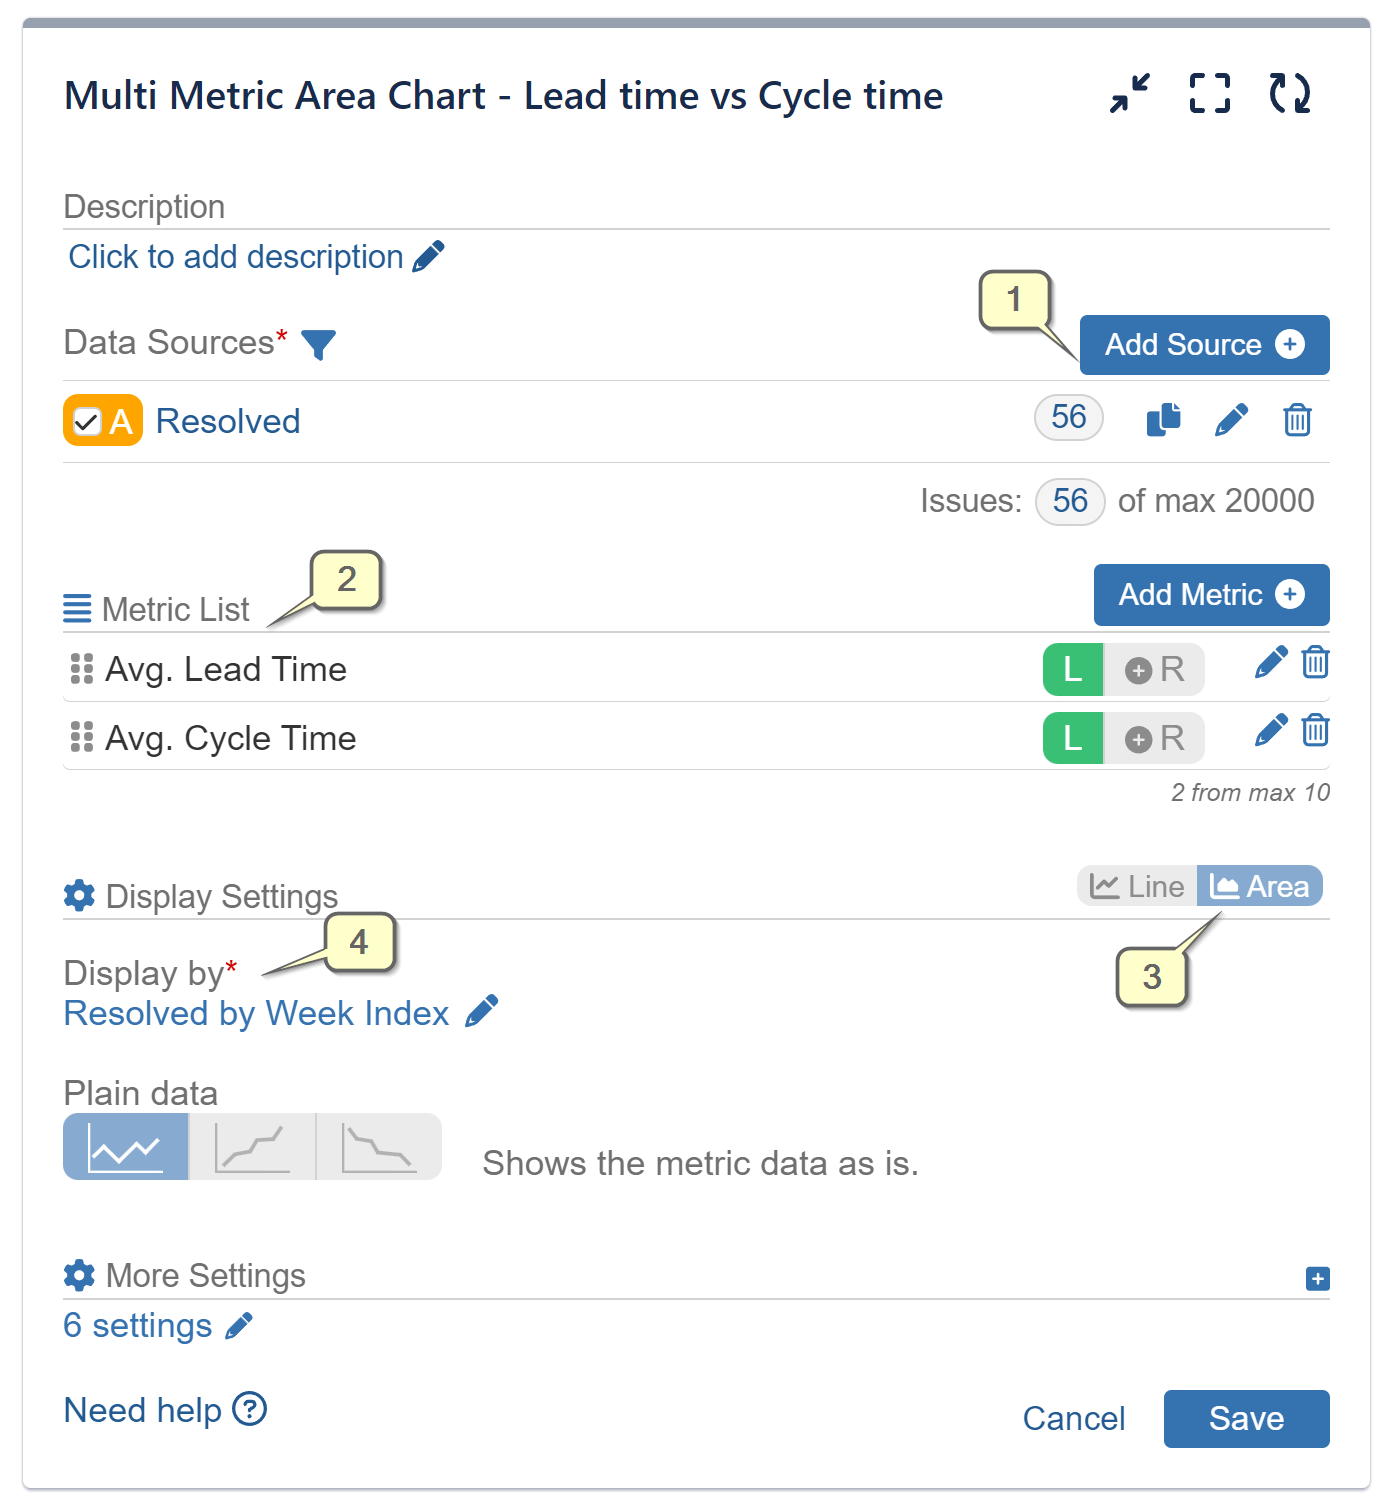
Step 1: Set your Data Source to filter only the issues you wish to analyze.
Step 2: Add two conditional metrics with custom names. For the first one, named “Avg. Lead Time” use the metric ‘Time Between’ and specify from “Created” to “Resolved.” For the “Avg. Cycle Time” metric, use ‘Time Between’ again, but specify from “In Progress” to “Resolved.” Detailed images for this step may be found below.
Step 3: Select an Area type of chart view.
Step 4: Display by the “Resolved” date field.
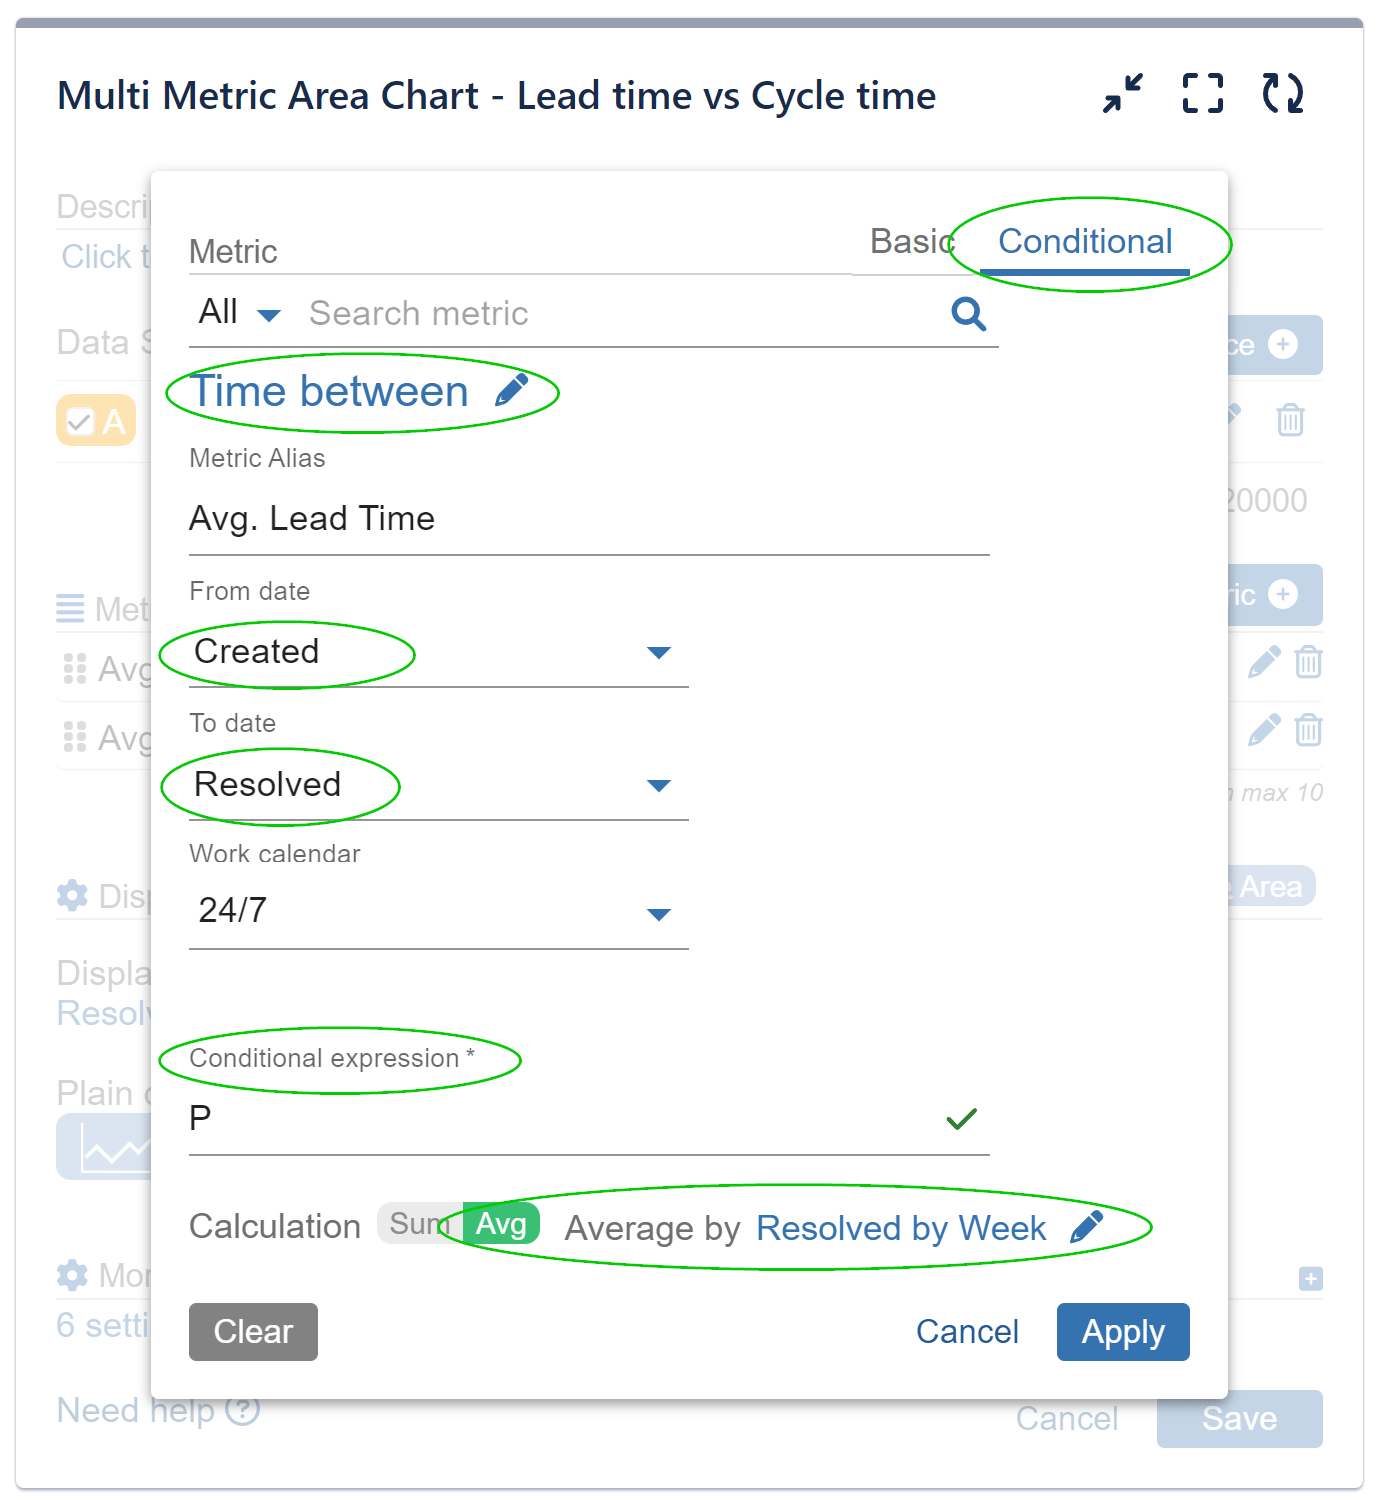
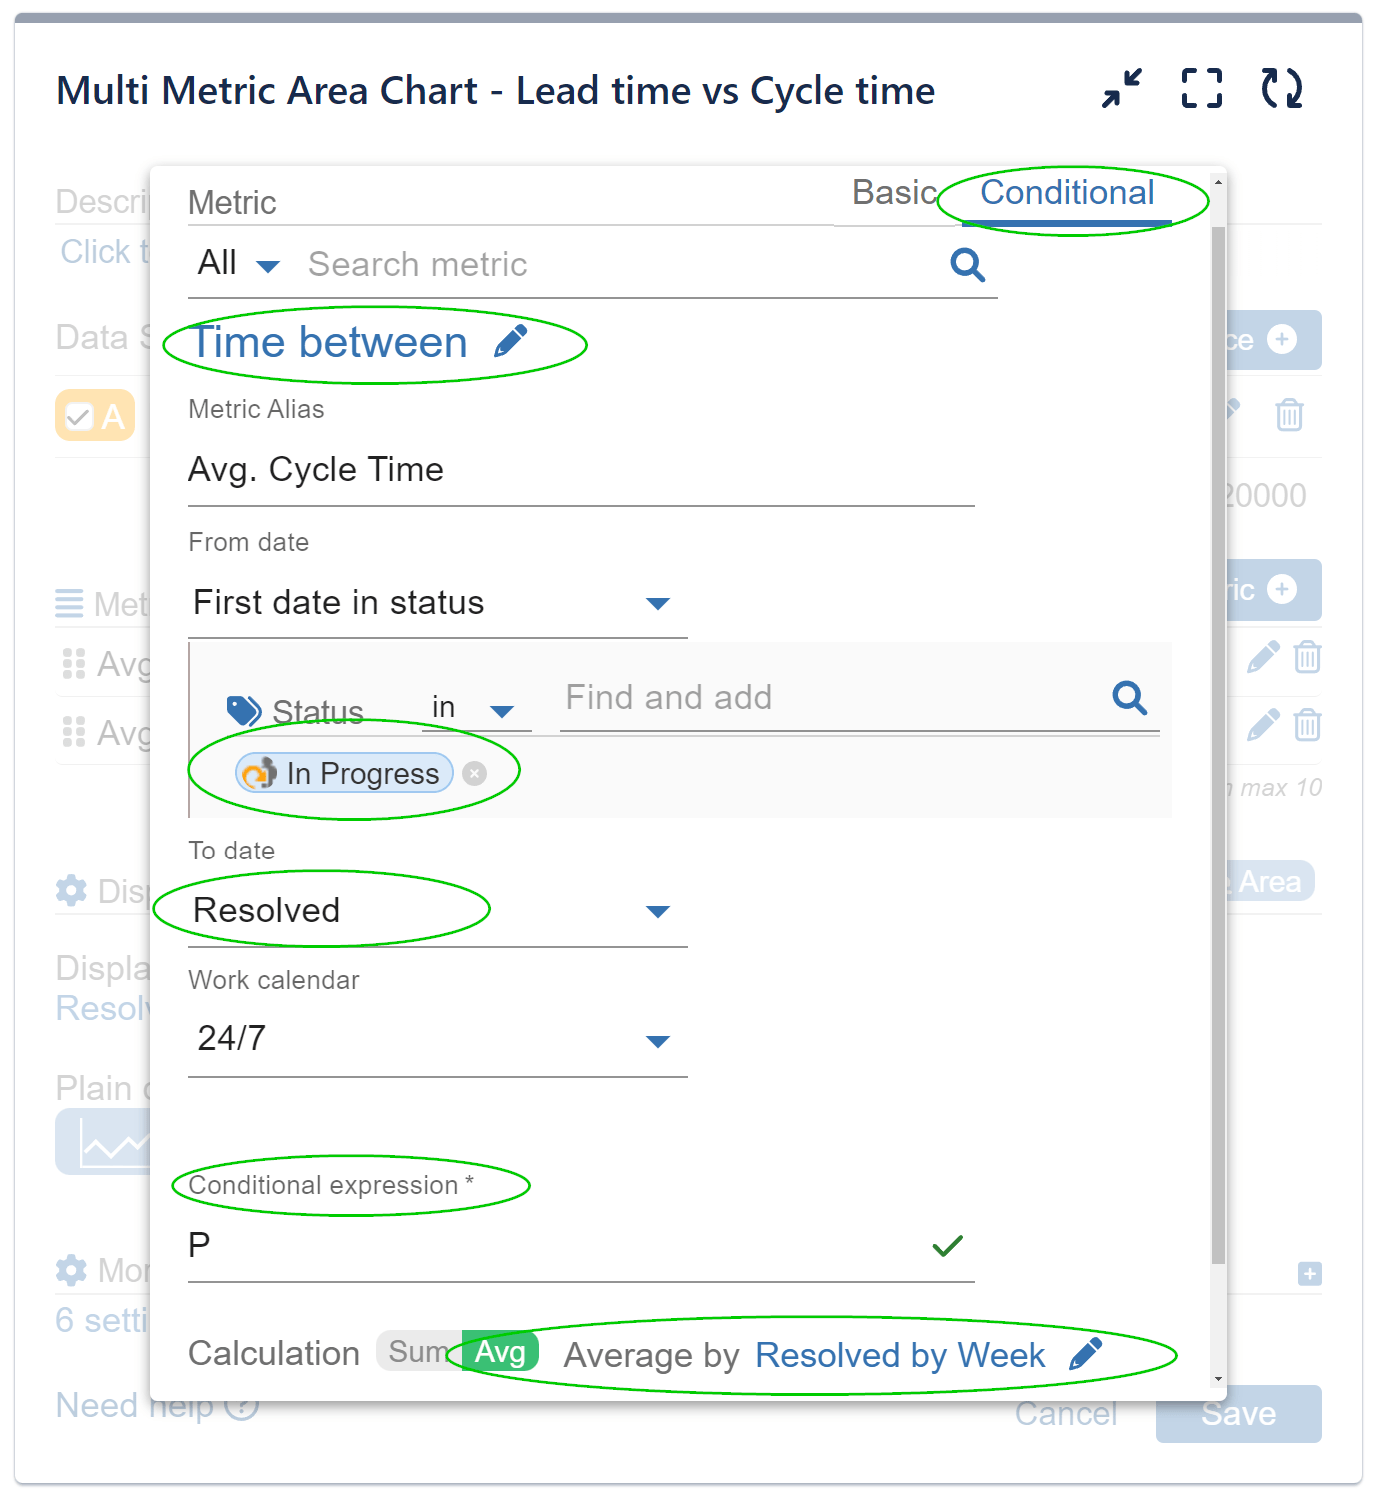
Please bear in mind that employing the Conditional feature (Conditional expression = P) for this report is optional. It grants you the capability to assign custom names to the pre-existing metric ‘Time between’ in a scenario where you intend to use it multiple times.
Feel free to delve deeper into the features of our multiple metrics gadgets by exploring their respective articles.
Check this user case for another example of how you can utilize Multi Metric Gadgets to enhance your Jira reporting: Support Requests Report by time of day.
If you need help with your multiple metrics configuration, please reach out to our support team.
Start your 30 days free trial of Performance Objectives: Charts for Jira from Atlassian Marketplace.