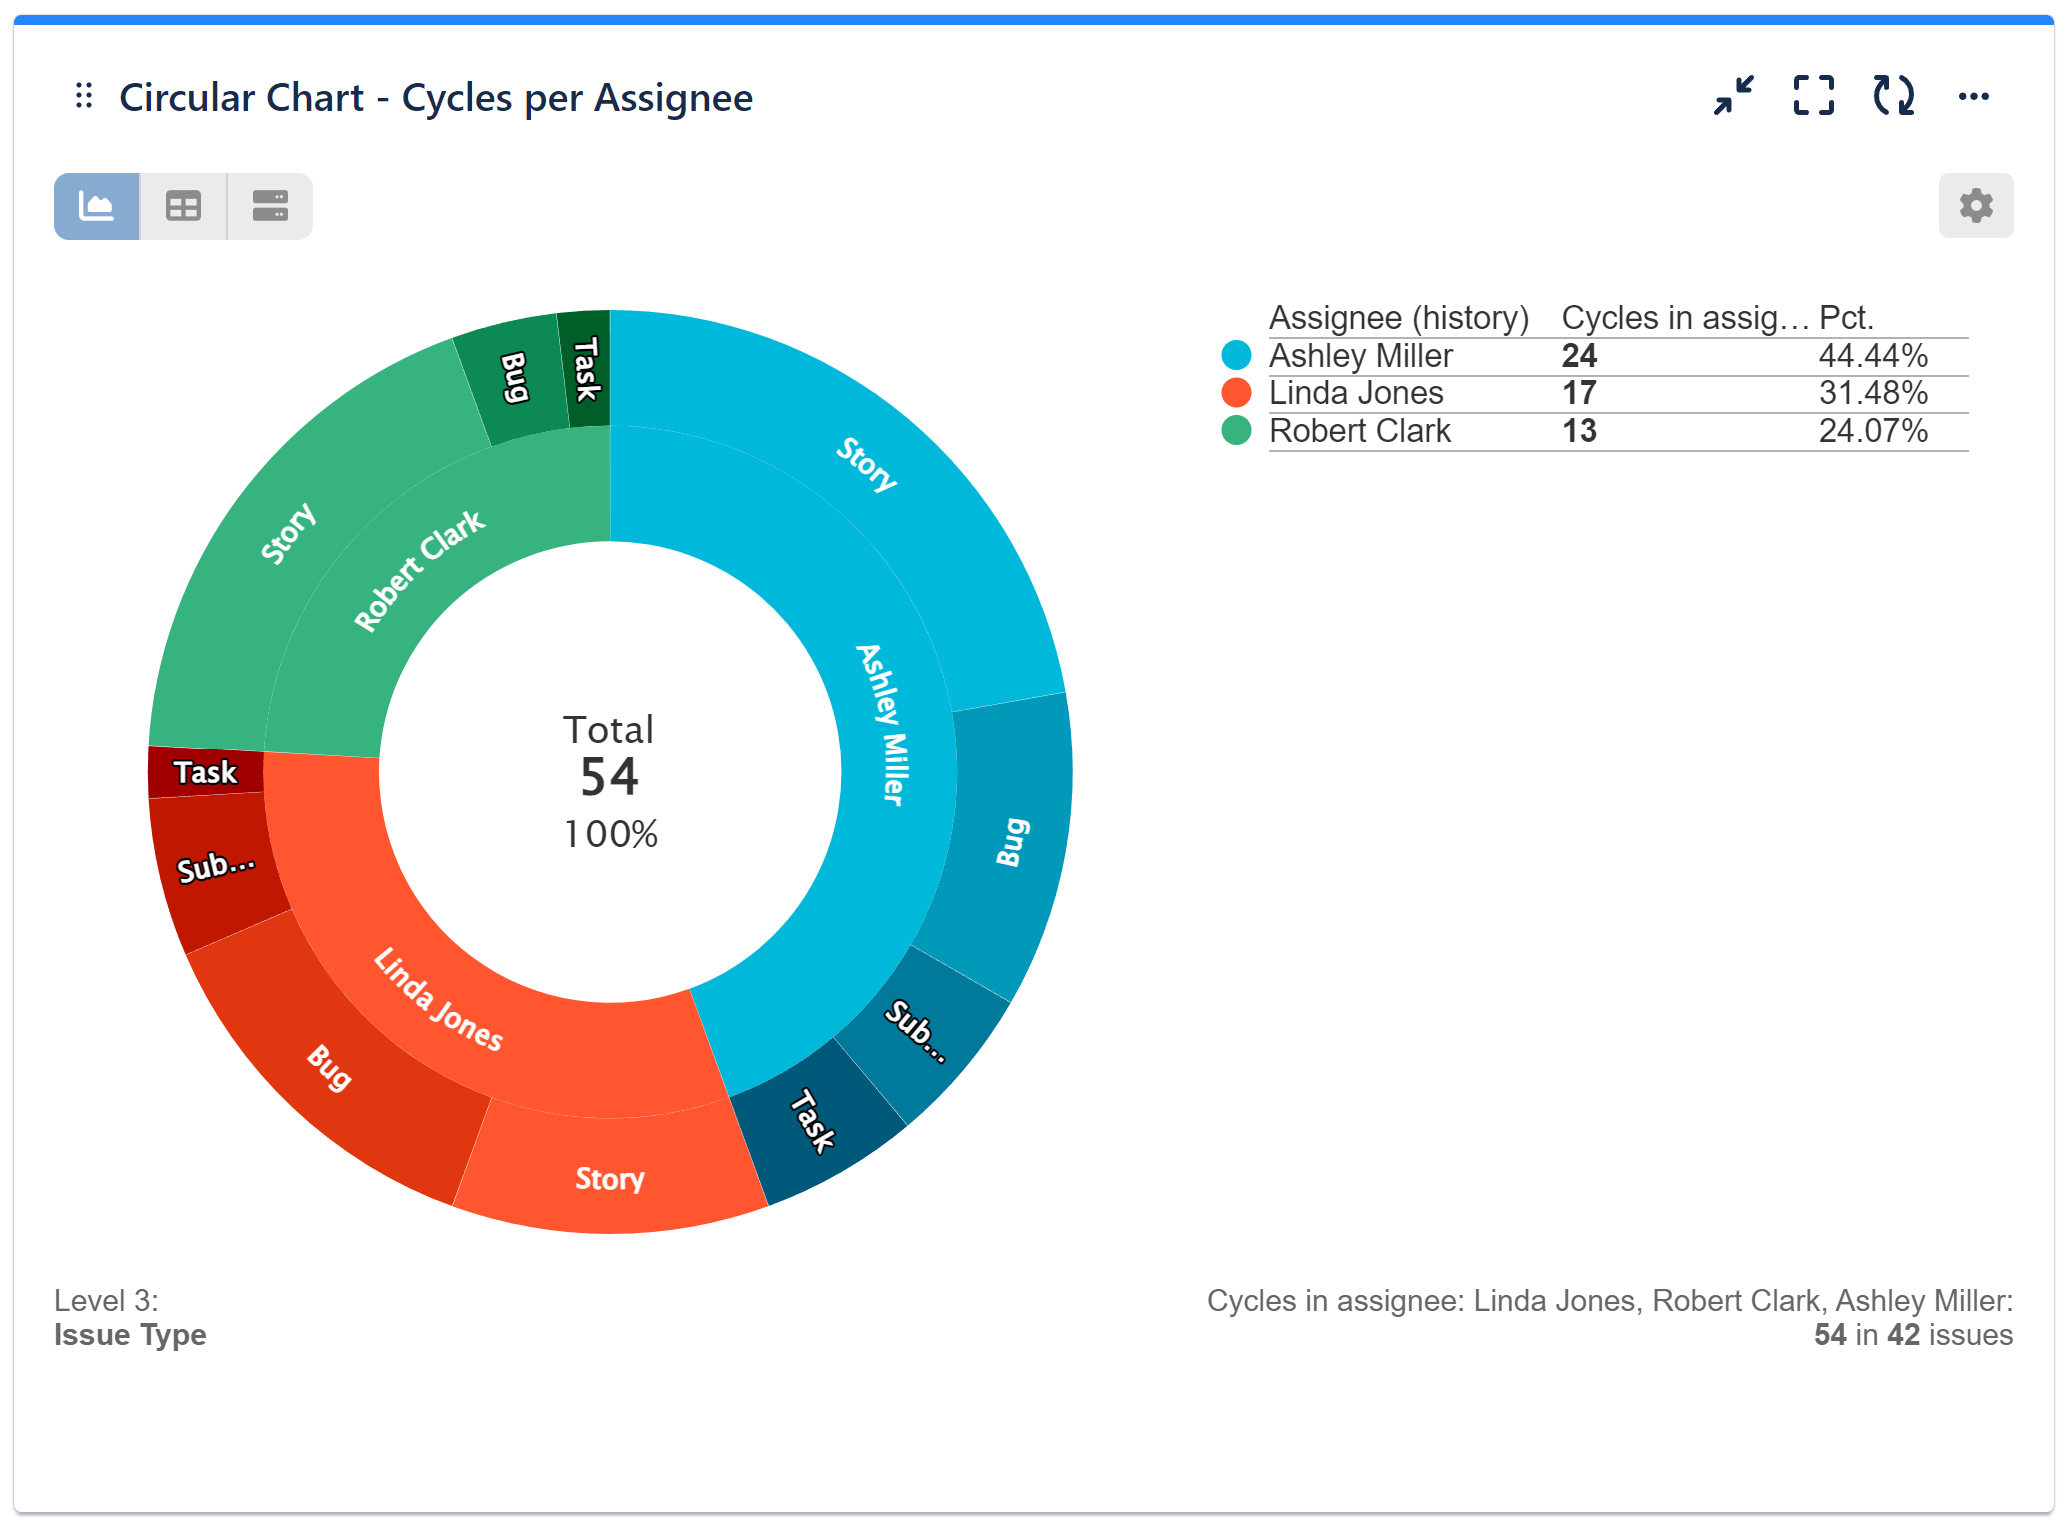
Track the number of cycles or how many times Jira issues get assigned to one or any of multiple users. Break down the metric by assignee history or status history and understand more about the back-and-forth cases that slow down the issue resolution. Set goals for particular users or a group of users, such as ‘First Contact Resolution’ or ‘Max 2 cycles on avg. per issue in assignee ‘.
Monitor Number of Cycles per Assignee with Our Circular Chart Gadget
Get these data metrics directly on your Jira dashboard using our ‘Circular chart’ gadget.

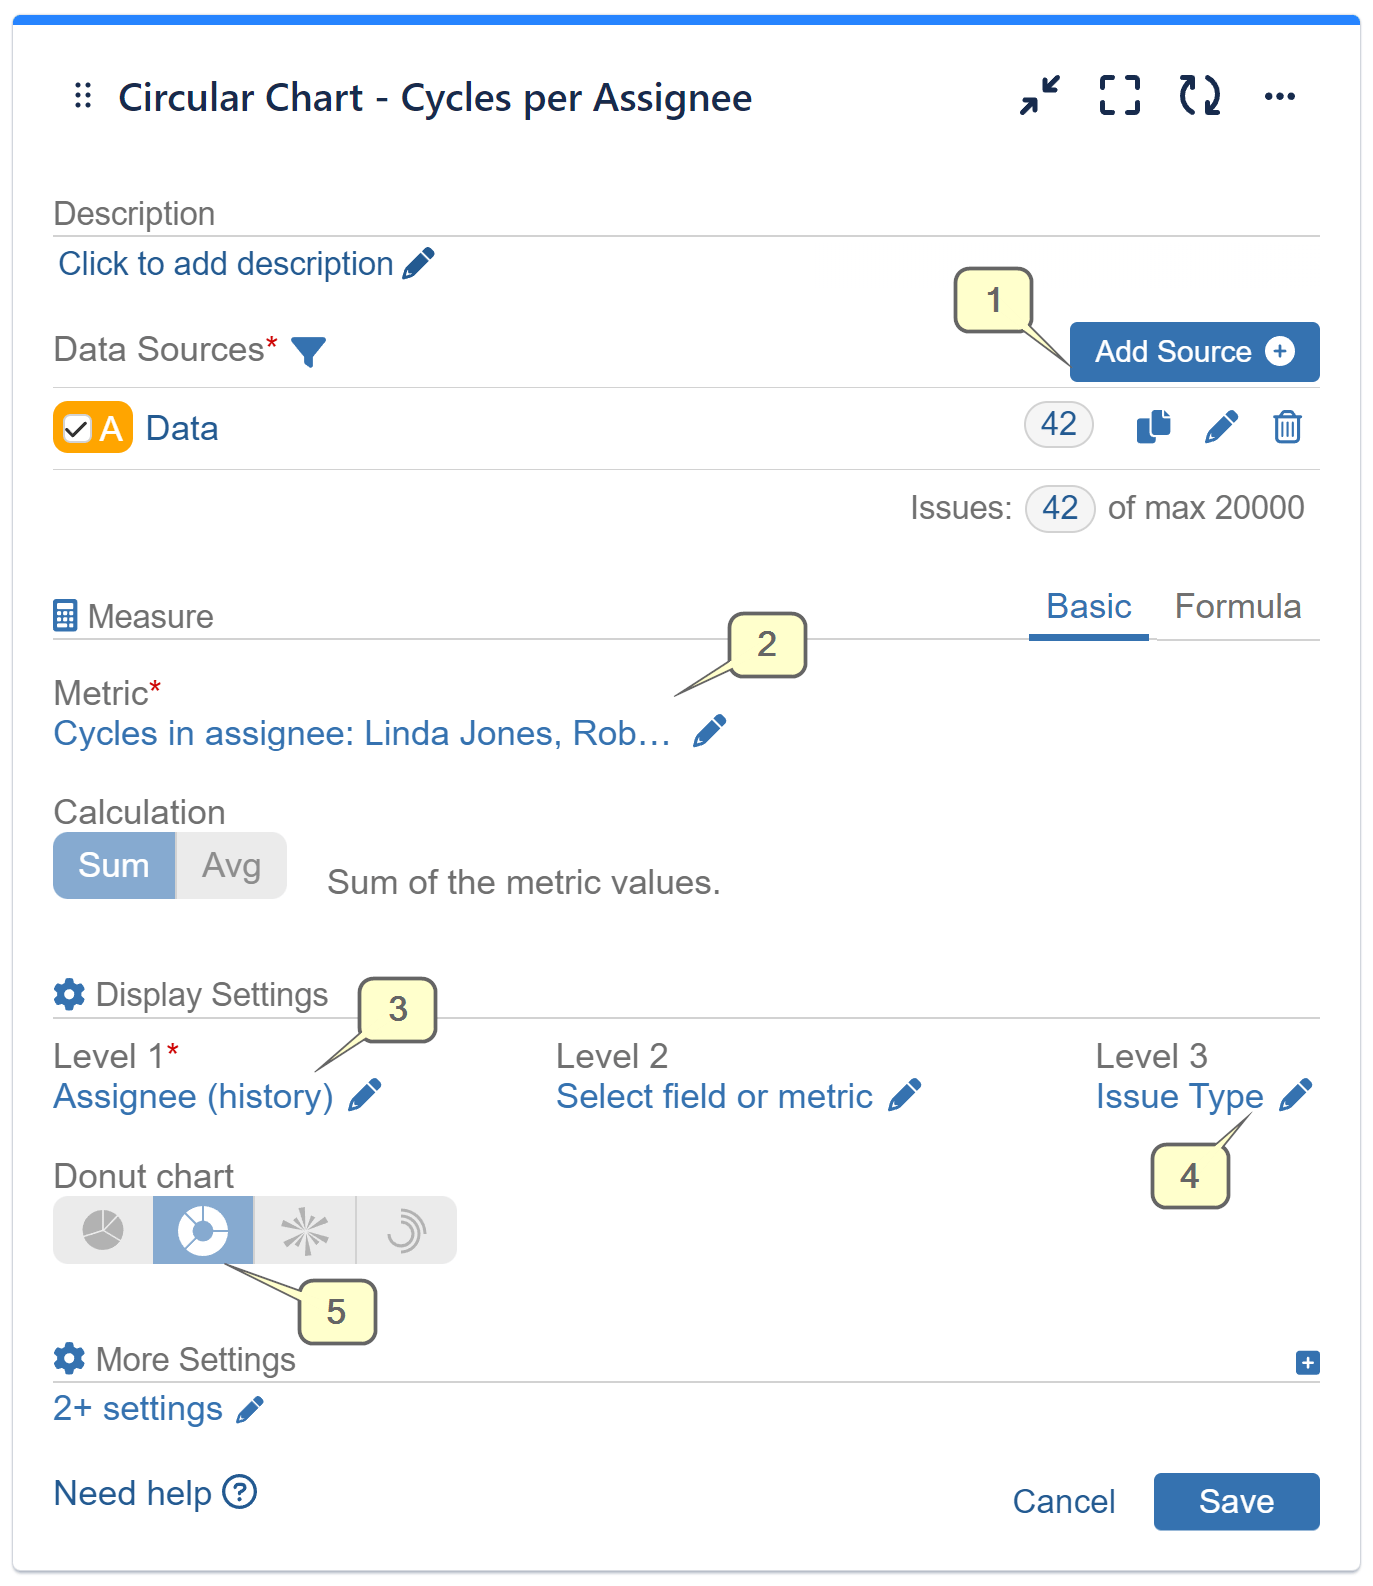
Please find the configuration steps below:

Step 1: Add data source. Filter out the Jira issues that need to be analyzed.
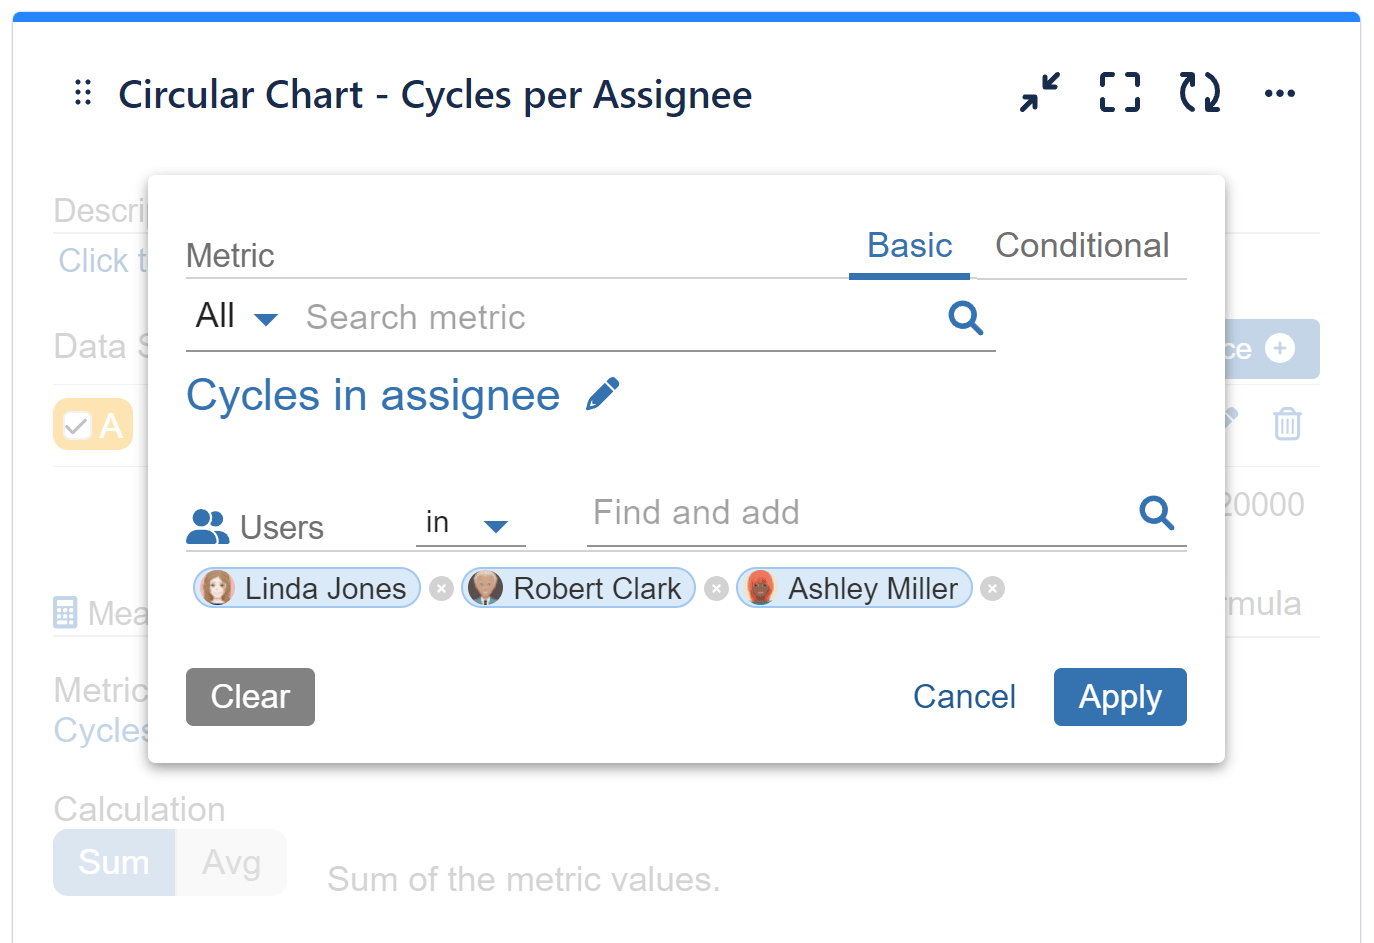
Step 2: Select ‘Cycles in assignee’ metric. Find and add the users who will be counted when an issue was assigned to any of them.
Step 3: Select Assignee (history) for ‘Level 1’. The field shows the cycles by the user to whom issues were assigned over time and becomes available after ‘Cycles in assignee’ metric selection.
Step 4: Select ‘Donut’ chart type.
Step 5: Choose ‘Stack by’ criteria as needed. On the picture above ‘Issue type’ is selected.

Here’s a detailed configuration screen for our sample report, focusing on Cycles in Assignee.
Additional Field Options After Choosing ‘Cycles in Assignee’ Metric
Other new fields options that are available after ‘Cycles in assignee’ metric selection are:
- Status (history) – field shows the cycles by the status to which issues were transitioned over time.
- Status change date – shows the metric by the historic moment of status change. That breaks down the cycles in assignee by status and helps identifying patterns in the metric movement over time.
- Assignee change date – shows the metric by the historic moment of assignee change. It allows to build “Cumulative Flow” diagram by cycles in assignee.
- First date in assignee / Last date in assignee – these date fields may be used in ‘Time between’, ‘Time since’ metrics in addition, like given in ‘Time in assignee‘ article.
The ‘Cycles in assignee‘ metric is available in dashboard gadgets “Performance objectives”, “Performance trend”, “Multi metric combined”, “Multi metric trend”, and “Circular chart”. It may be used when setting a Target or parameter in the Formula metric.
Related articles: Time in assignee, Time in status, Cycles in status.
Start your 30 days free trial of Performance Objectives: Charts for Jira from Atlassian Marketplace.