‘Number of overdues’ is a dynamic Performance Objectives metric that can elevate your Jira reporting by revealing the frequency of Jira issues or customer support requests surpassing their due date. This powerful metric is compatible with nine out of ten of the app’s gadgets, enabling you to use the estimation for setting KPIs, performance management, and managing customer satisfaction effectively.
Track Number of Overdues
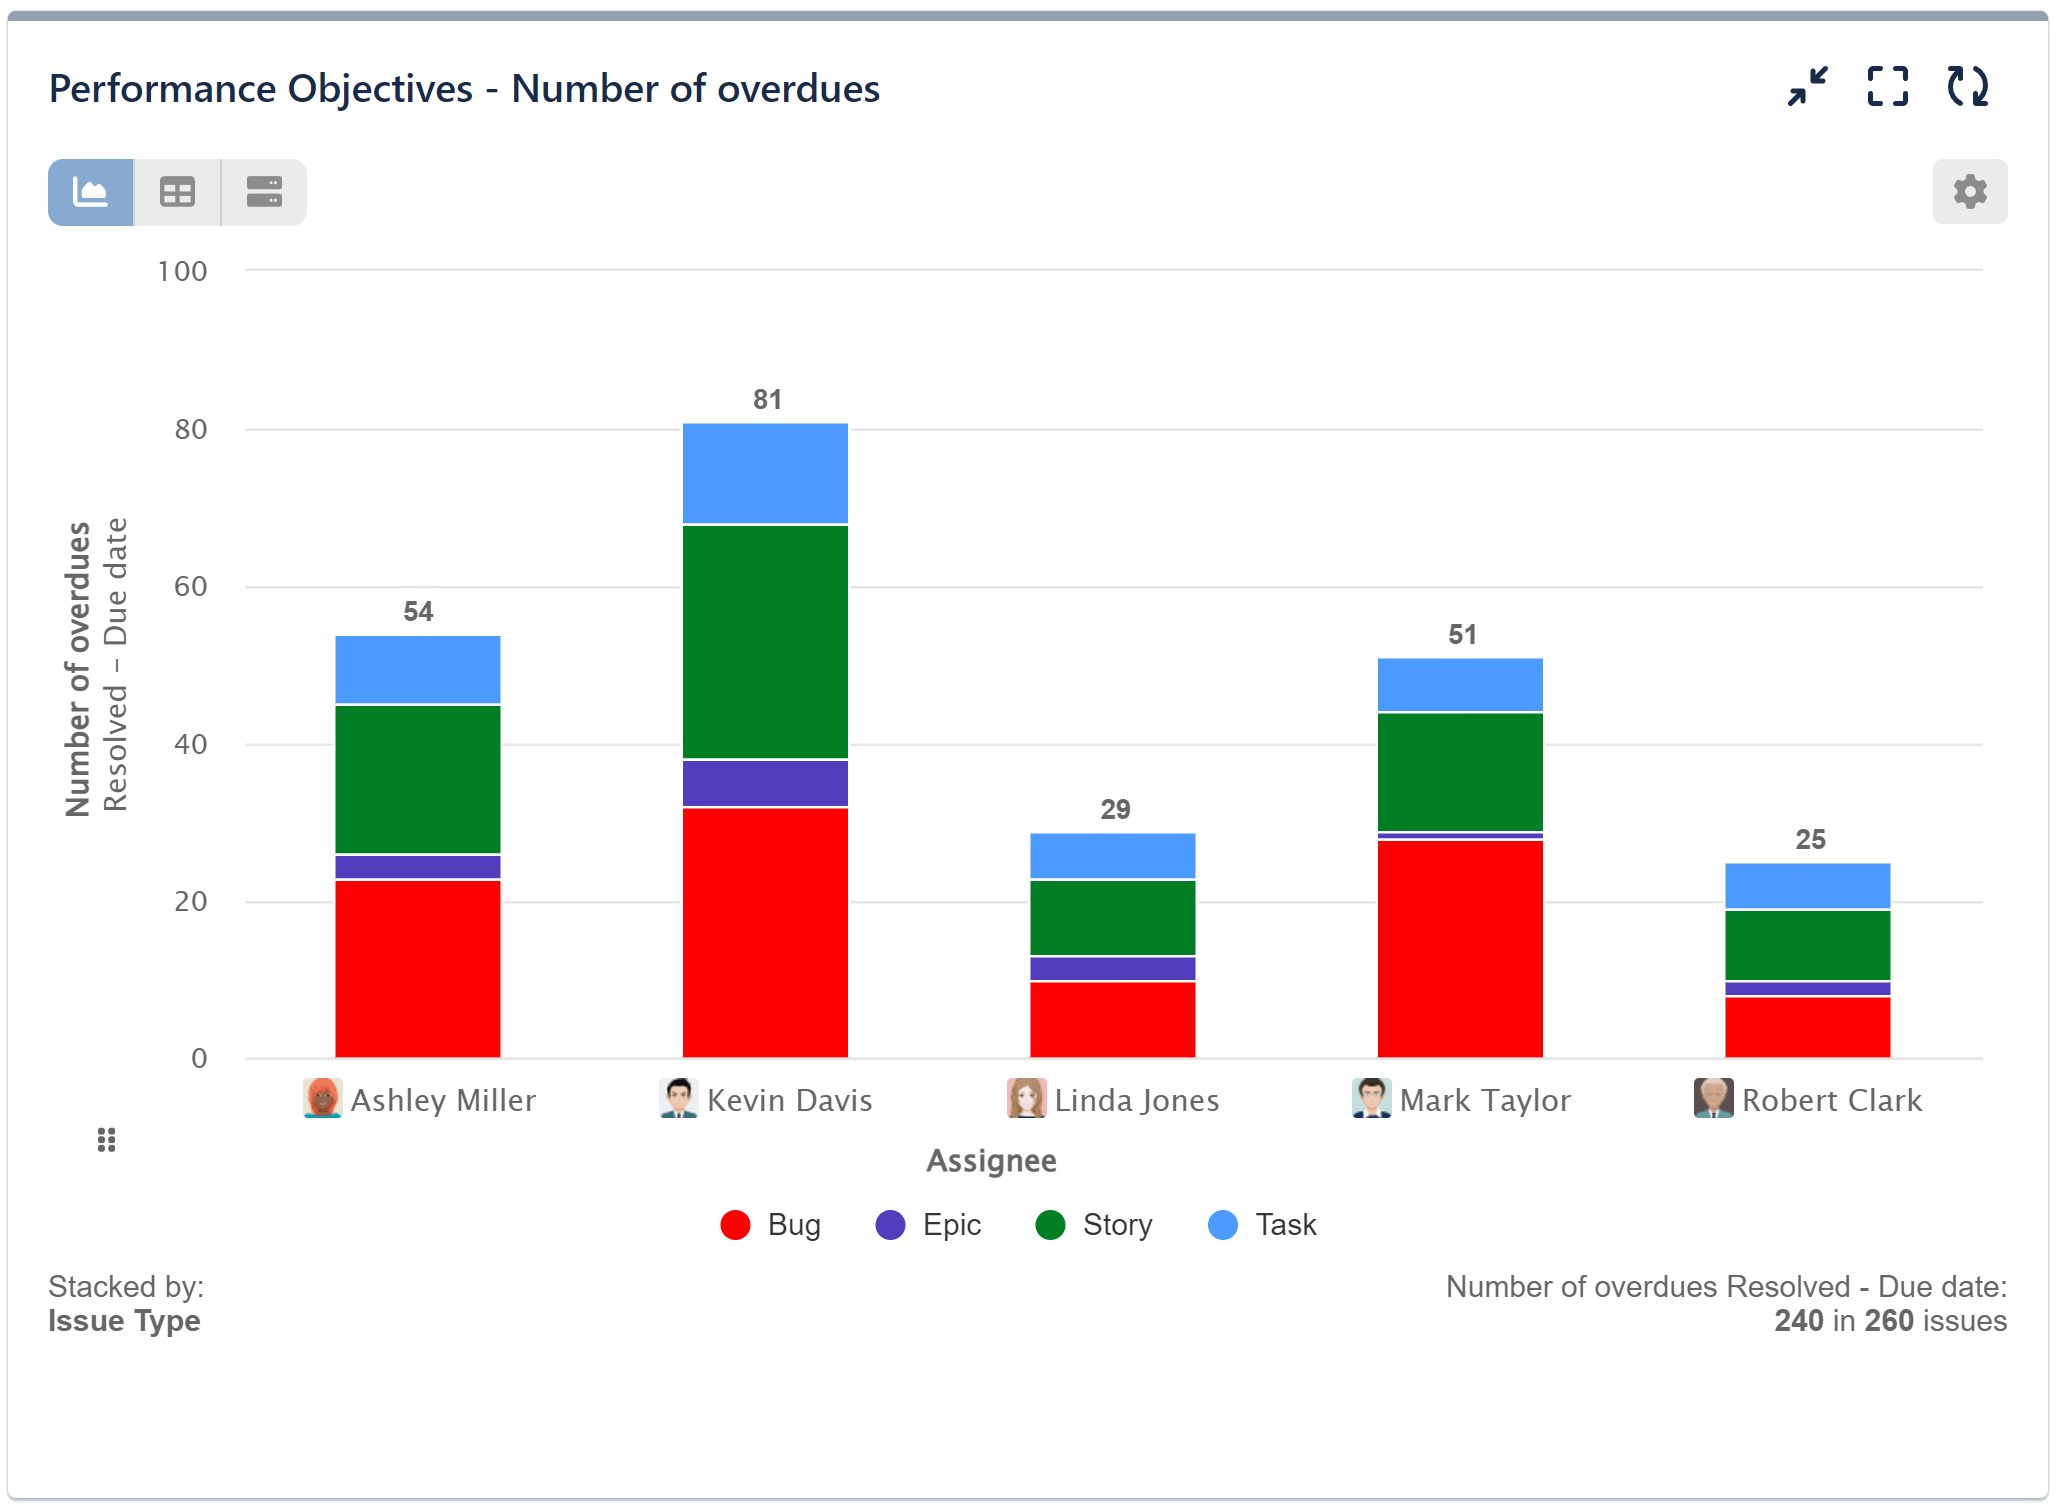
This metric will only count issues where the actual date is after the due date. For instance, in the example below, done with the Performance Objectives gadget, only issues with a ‘Resolved’ date after the ‘Due date’ will be counted. You can choose any other date field from Jira for the ‘Actual date’ and ‘Due date’ to analyze accordingly.
For a comprehensive list of all date field types supported by the app, please refer to Configuration Overview.

To create such chart, please review the configuration screen with the ‘Number of overdues’ metric selection option.

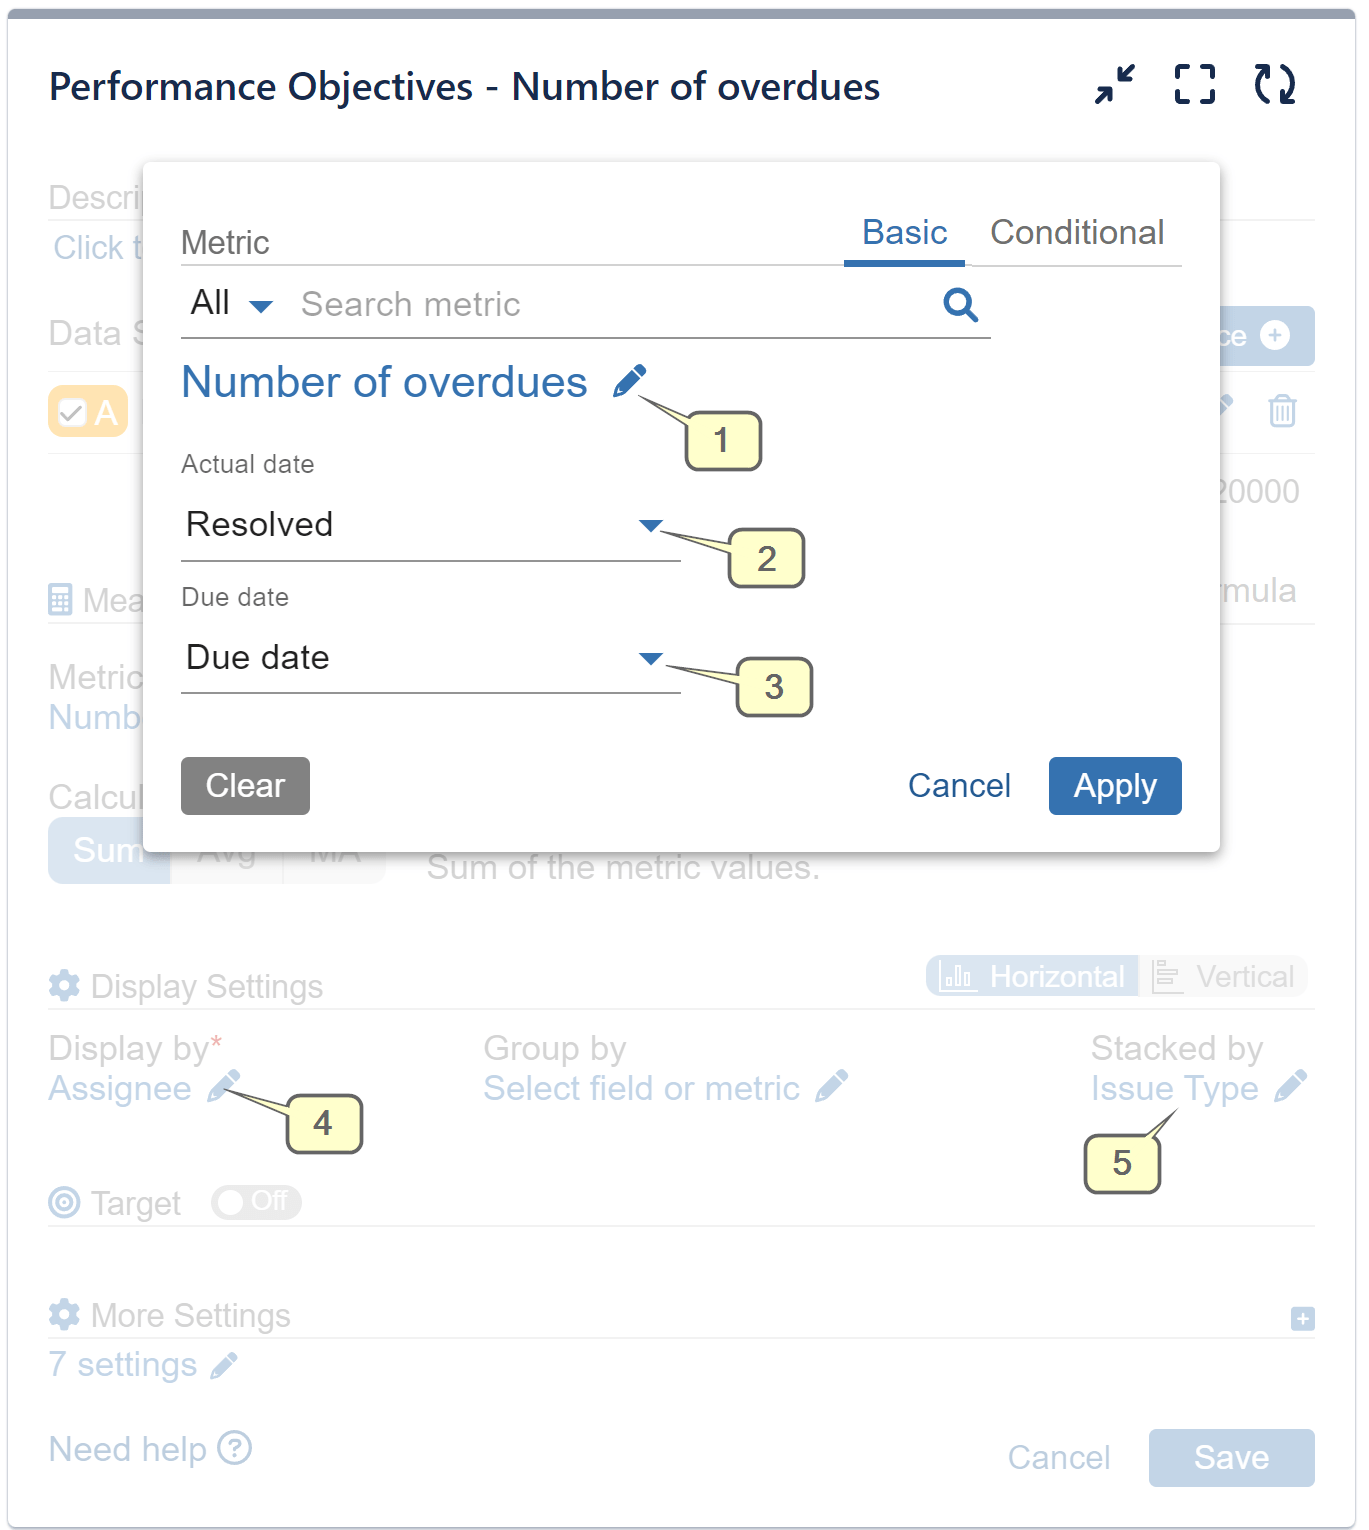
Step 1: Choose the data source/s you wish to analyze.
Step 2: Select the ‘Number of overdues’ metric.
Step 3: Set ‘Actual date’ to ‘Resolved’ and ‘Due date’ to ‘Due date’.
Step 4: Configure ‘Display by’ with the ‘Assignee’ field.
Step 5: Configure ‘Stacked by’ with the ‘Issue type’.
Track Percentage of Overdue Issues
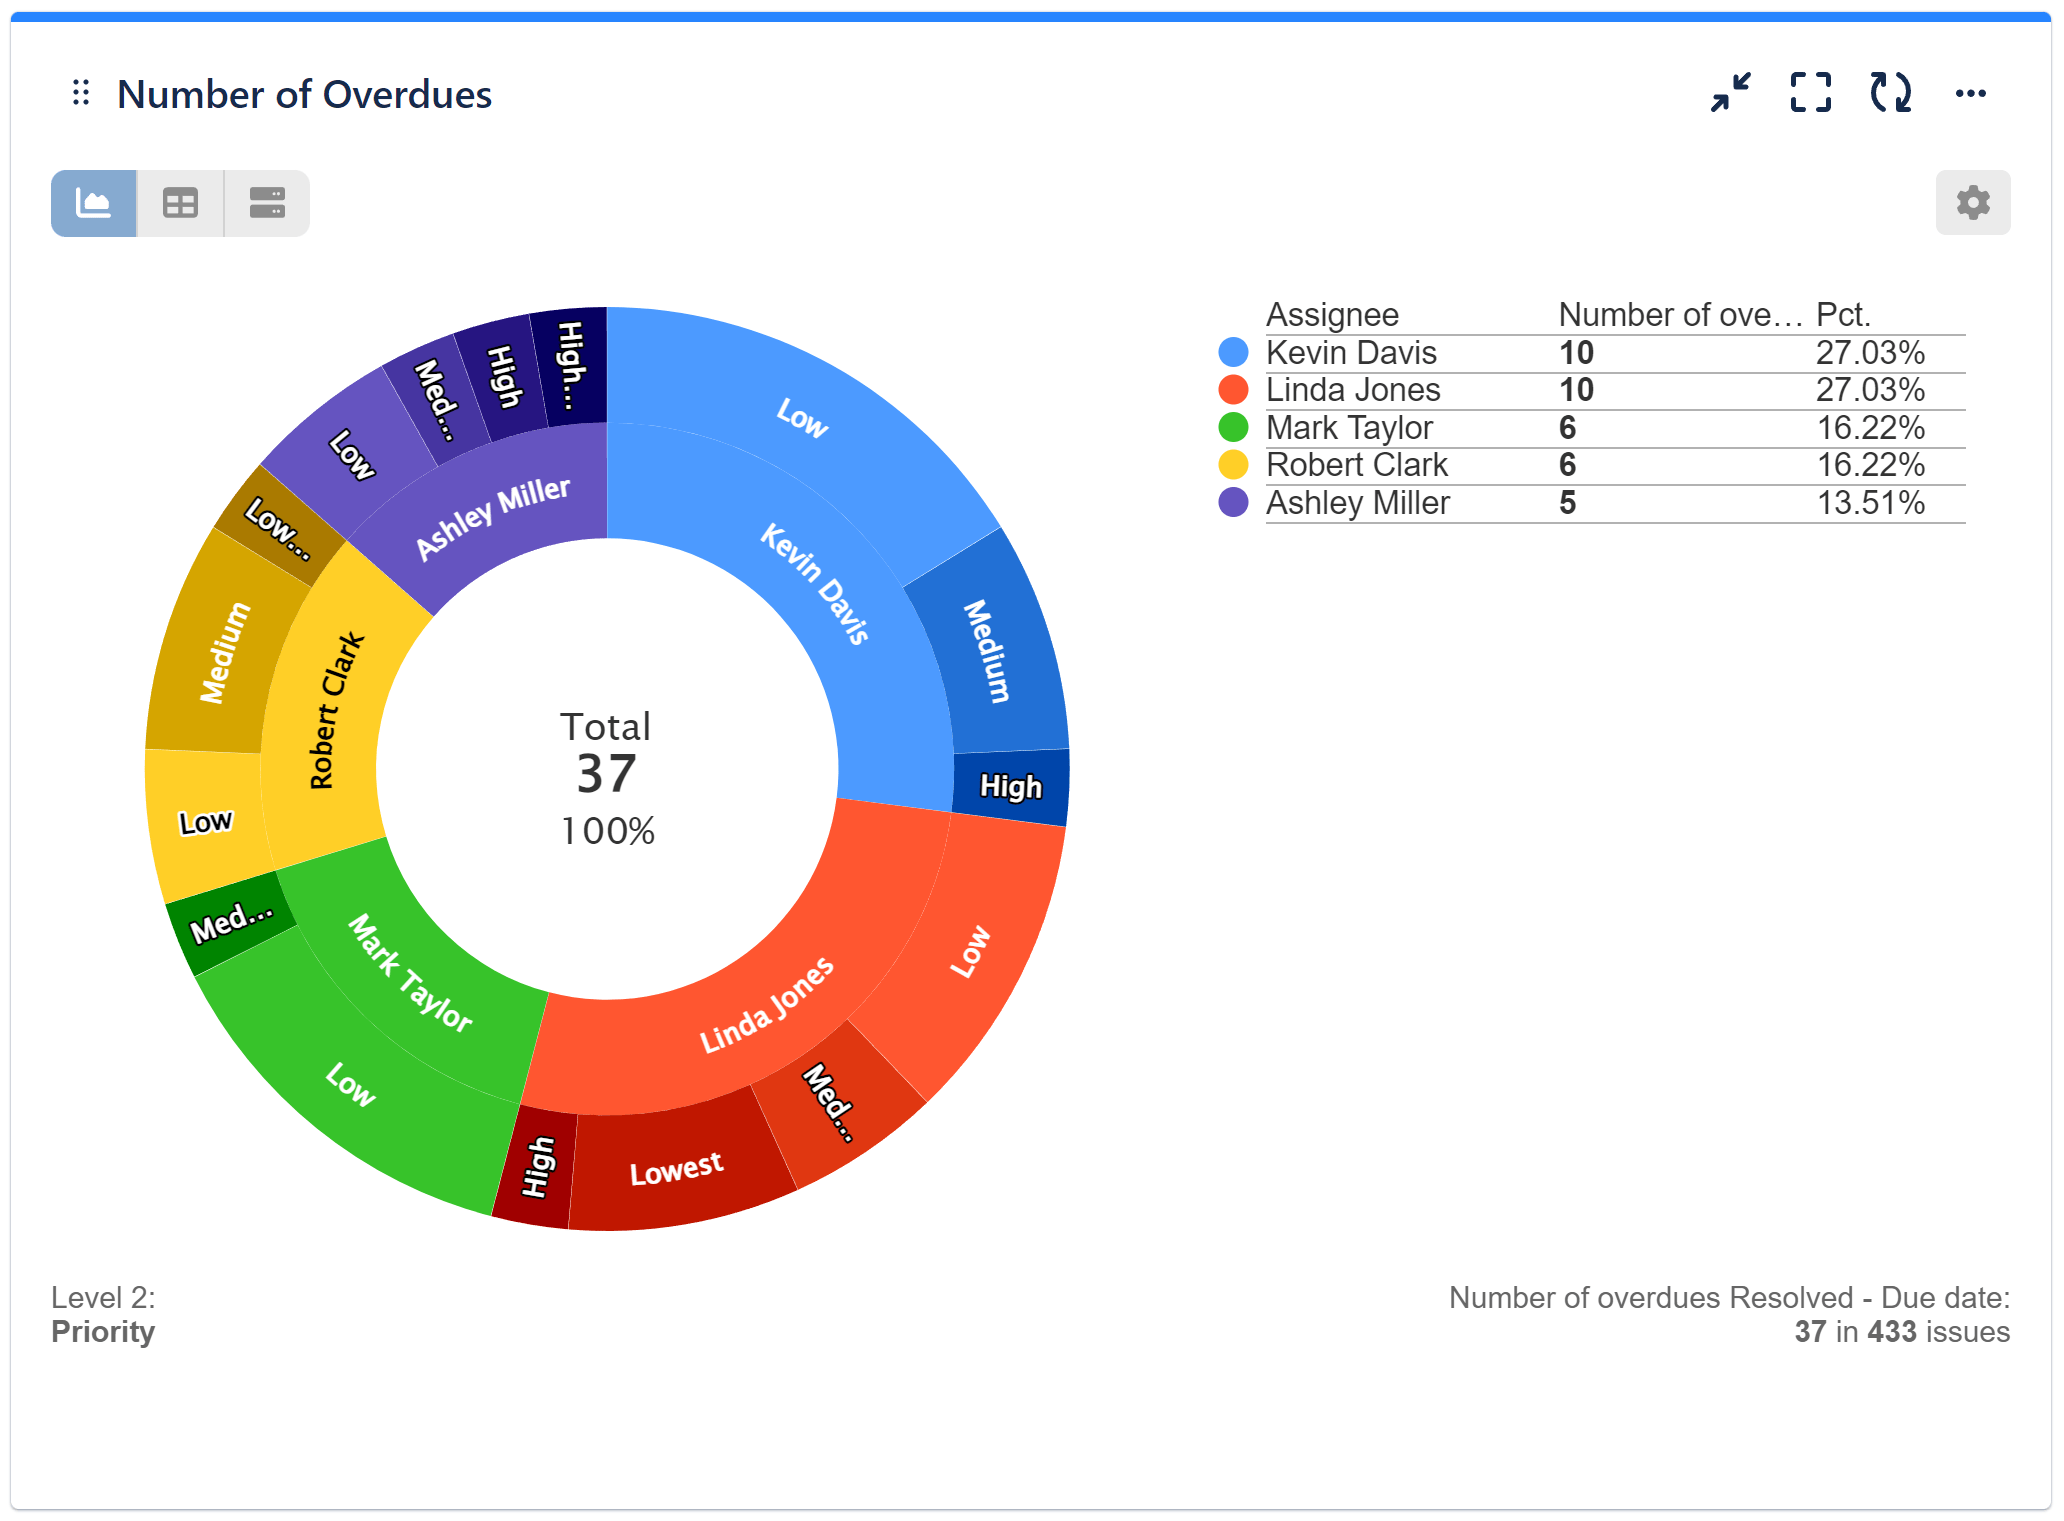
Explore yet another powerful option to visualize issues that have exceeded their due date within a specific timeframe as a percentage of the total. Enhance your analysis by incorporating fields relevant to your needs for the 3 Levels of display settings of a Donut chart available in our Circular gadget. The chart below illustrates the percentage of overdue issues per assignee and priority, offering valuable insights for your Jira projects and team performance.

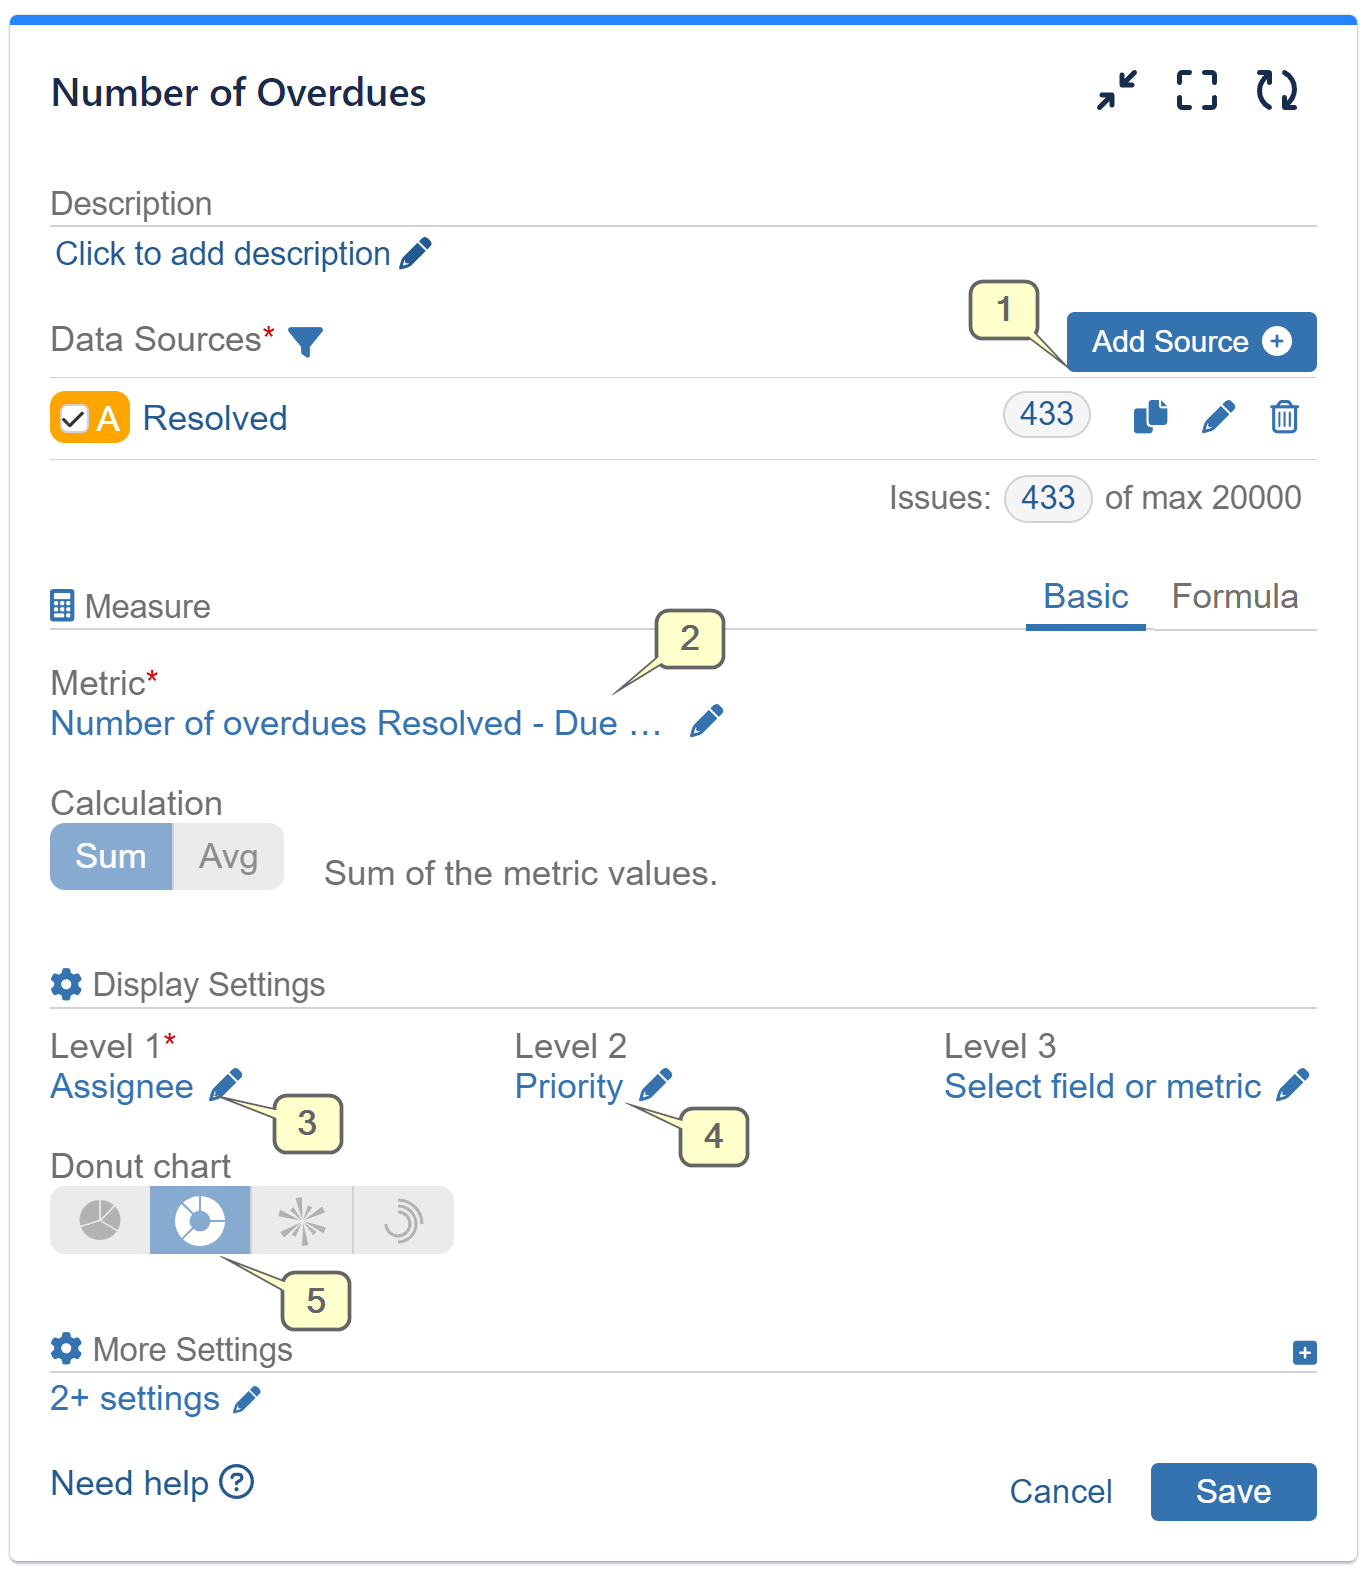
Check the configuration screen for this chart:

Step 1: Choose the data source/s you wish to analyze.
Step 2: Select the ‘Number of overdues’ metric and set ‘Actual date’ to ‘Resolved’ and ‘Due date’ to ‘Due date’.
Step 3: Configure ‘Level 1’ with the ‘Assignee’ field.
Step 4: Configure ‘Level 2’ with the ‘Priority’ field.
Step 5: Select Donut chart and save
Related articles: Remaining to due date, Overdue time from date, Time between, Time since, Conditional Metrics.
Start your 30 days free trial of Performance Objectives: Charts for Jira from Atlassian Marketplace.