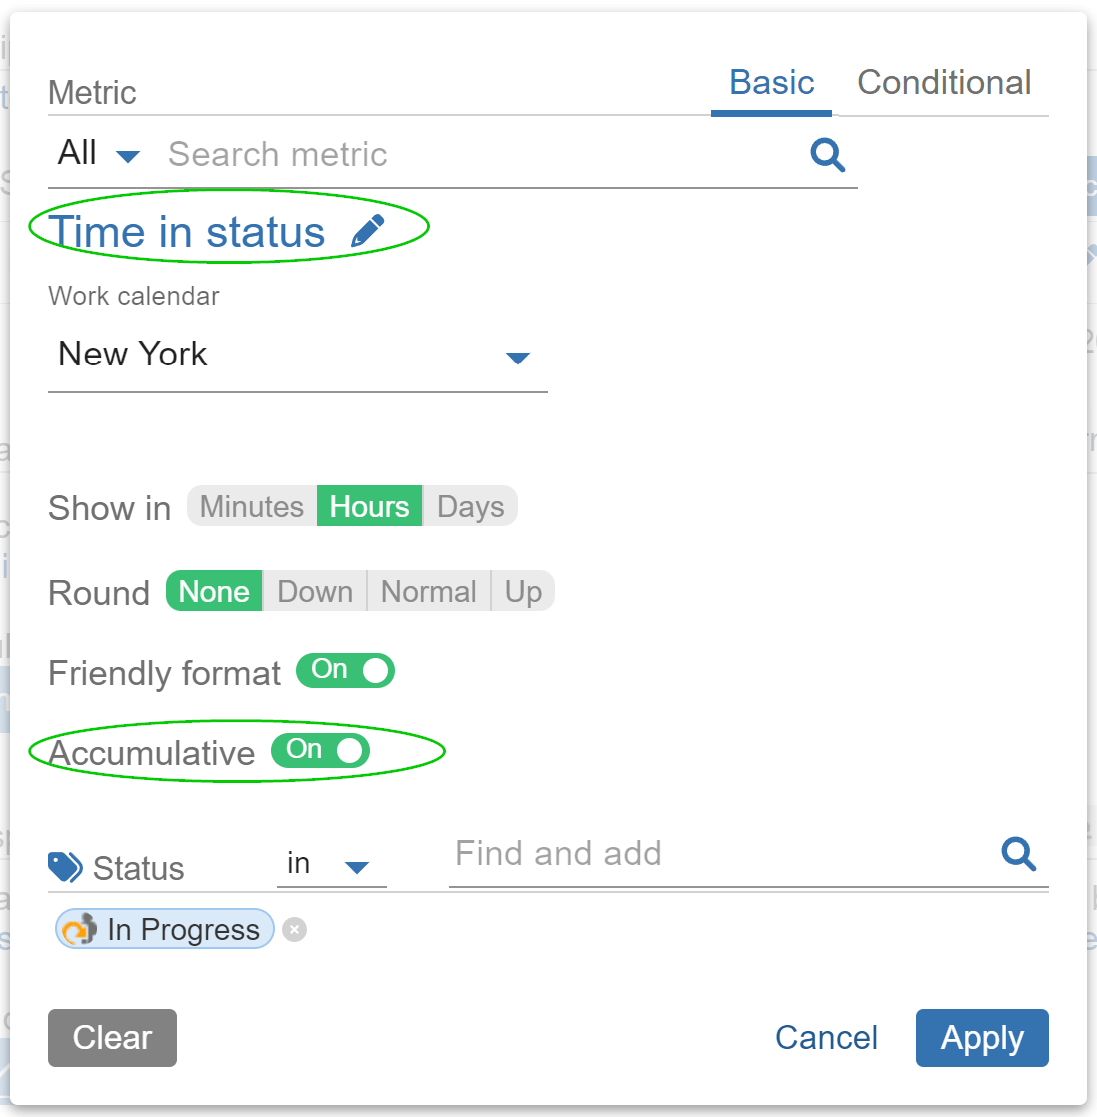
The Accumulative toggle is an option enabled after you select either the ‘Time in Status’ or ‘Time with Assignee’ metric and display data by ‘Status change date’ or ‘Assignee change date’ fields. Activating this toggle will display the uninterrupted accumulated time in a specific status or with a particular assignee over time. This means that it accumulates time only if the issue remains in the same status or with the same assignee without transitioning to another.
This capability is highly valuable for identifying issues that are stuck in certain status/es or with specific assignee/s for longer than expected and assists in tracking performance trends over time.

How It Works – Sample Calculations in Plain and Cumulative Mode, and Accumulative Toggle
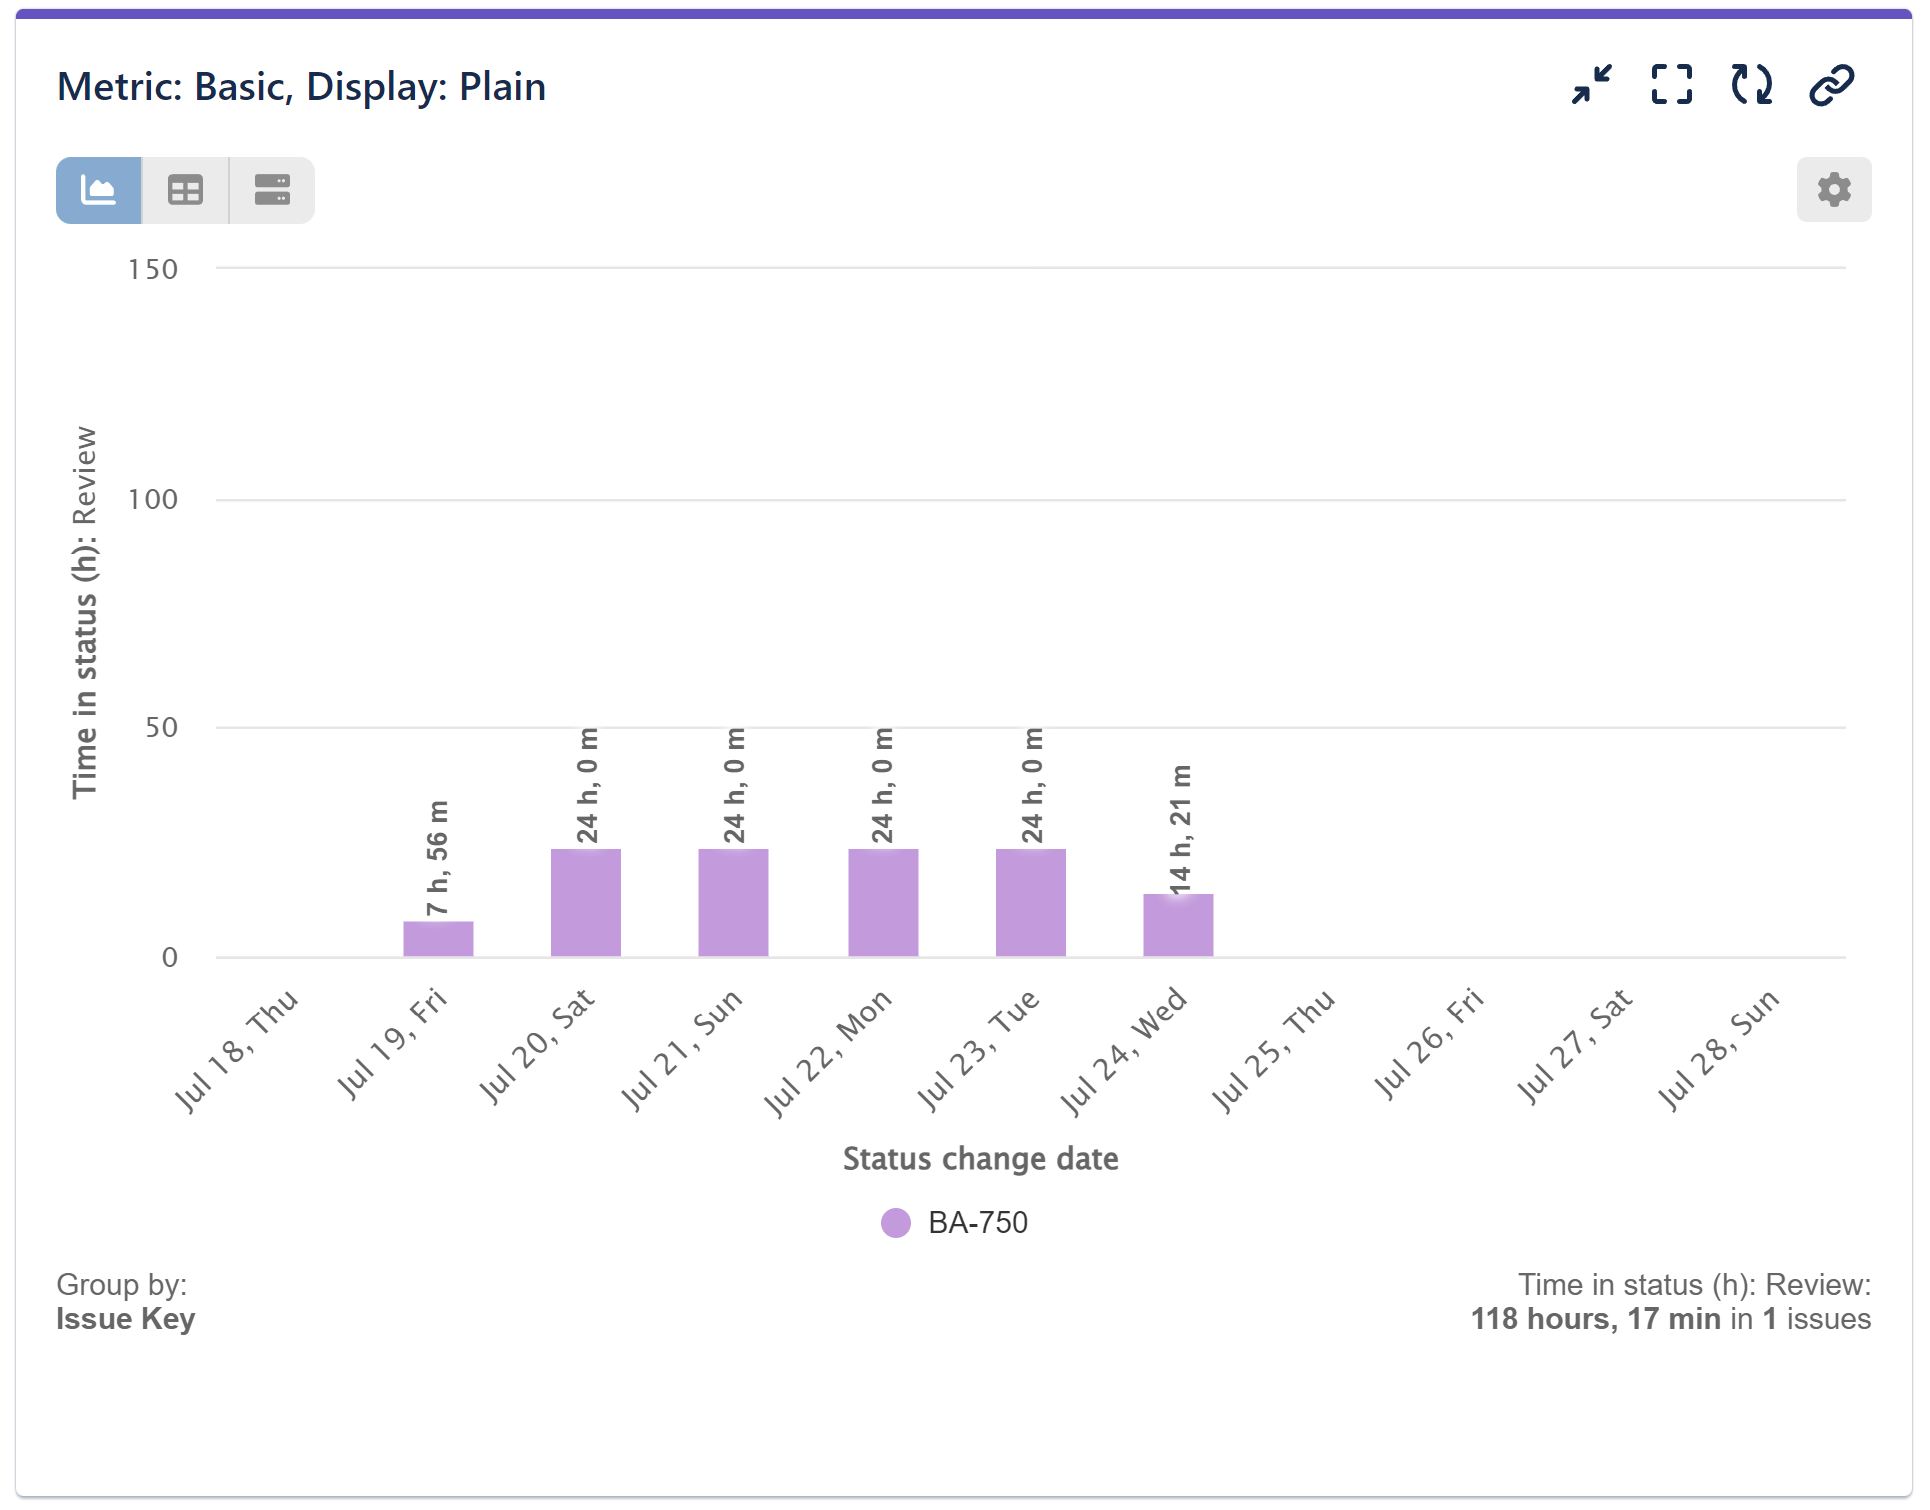
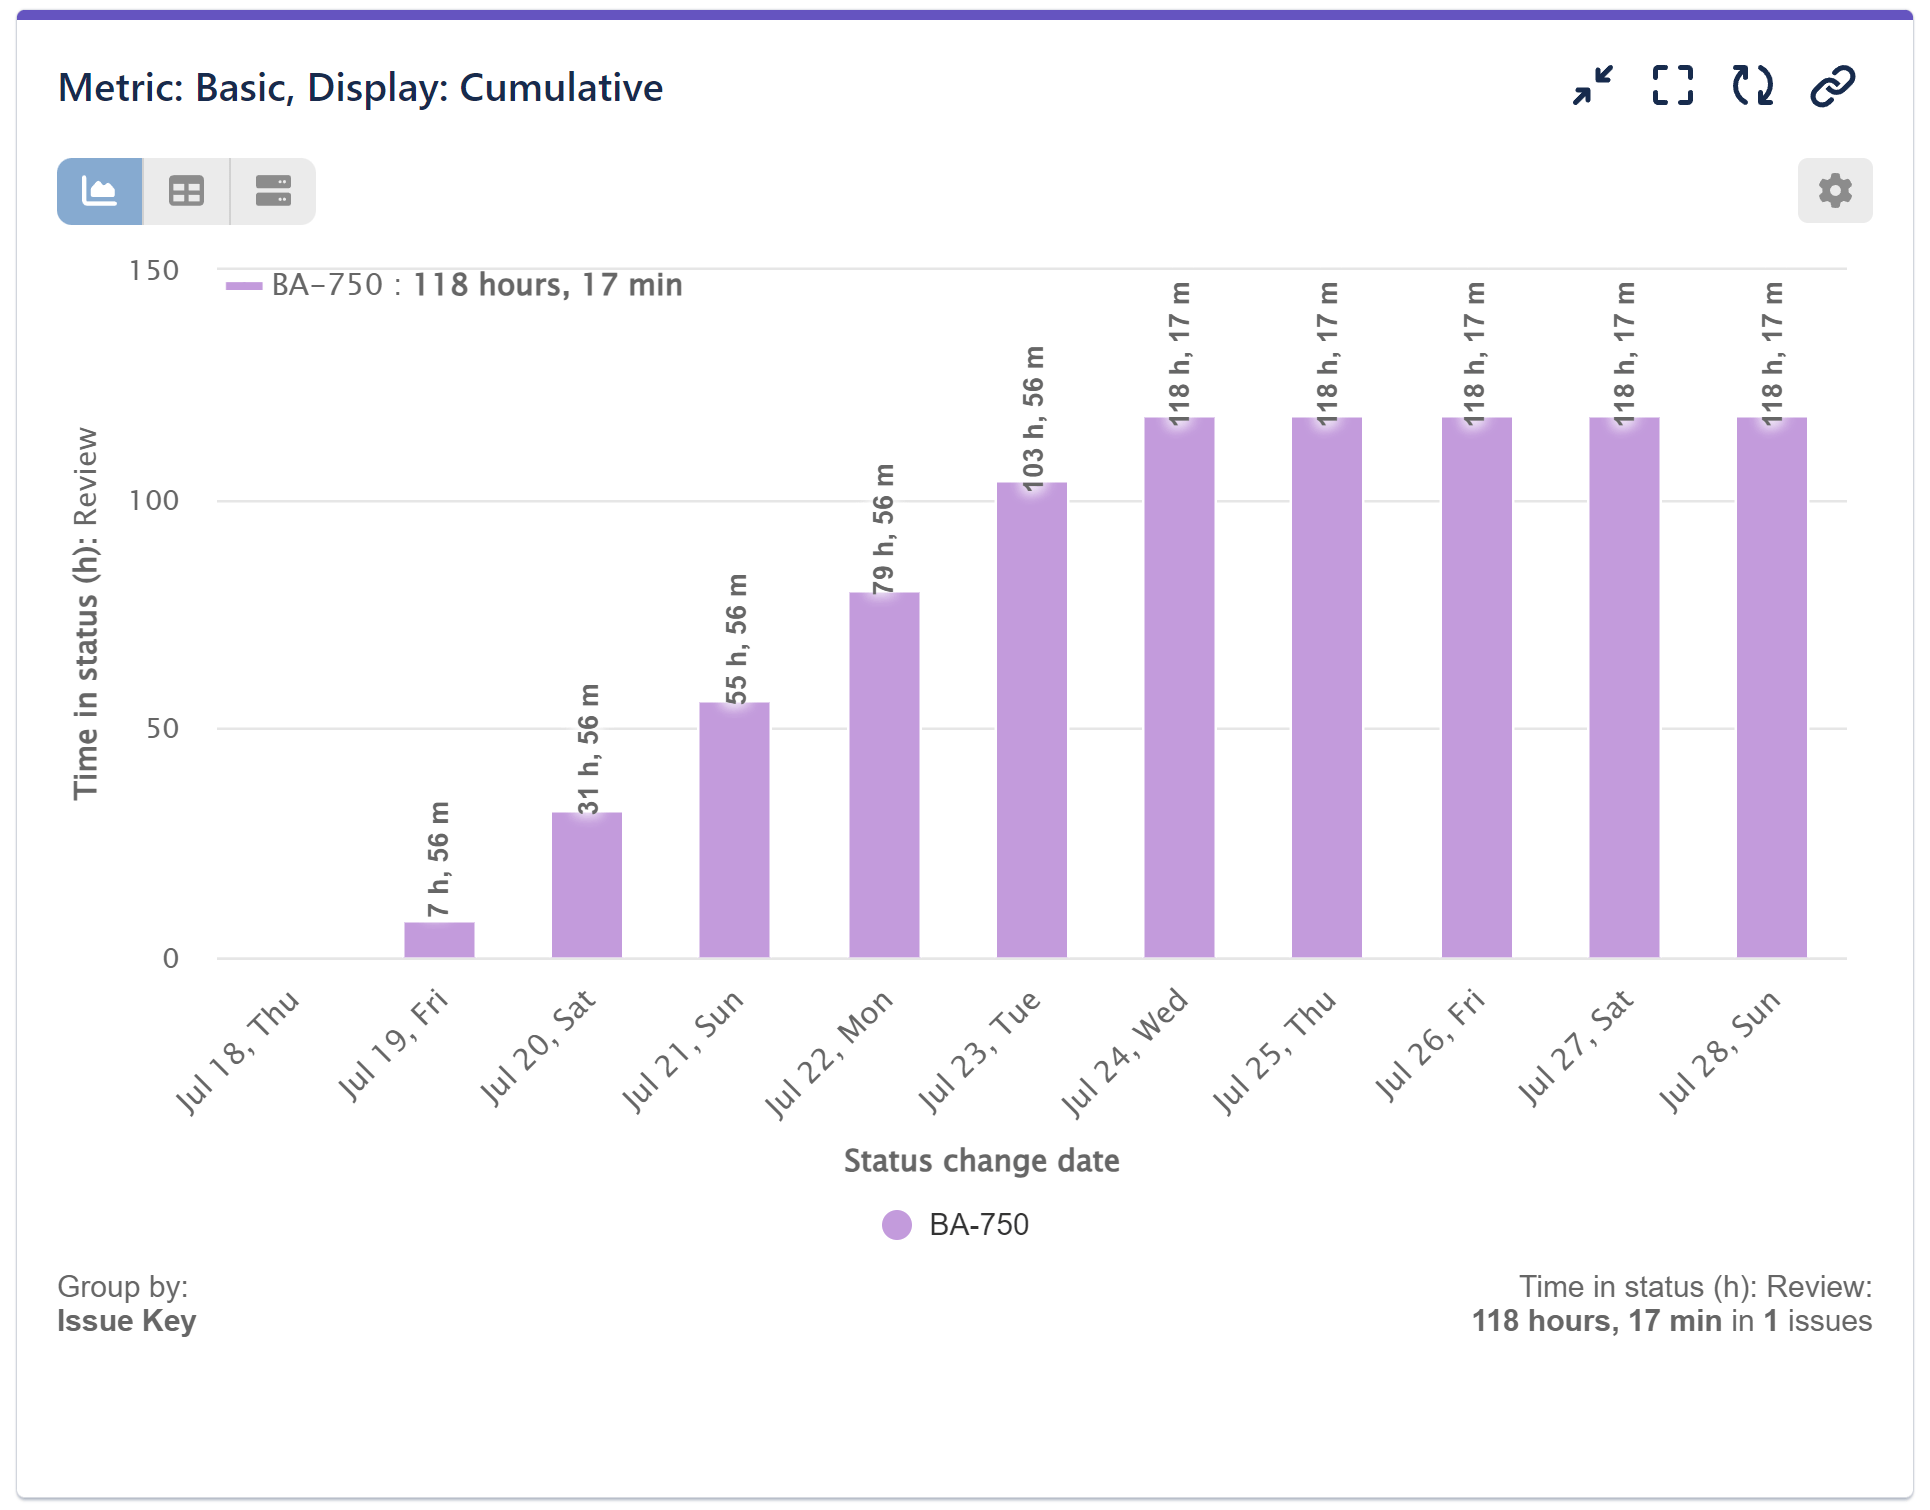
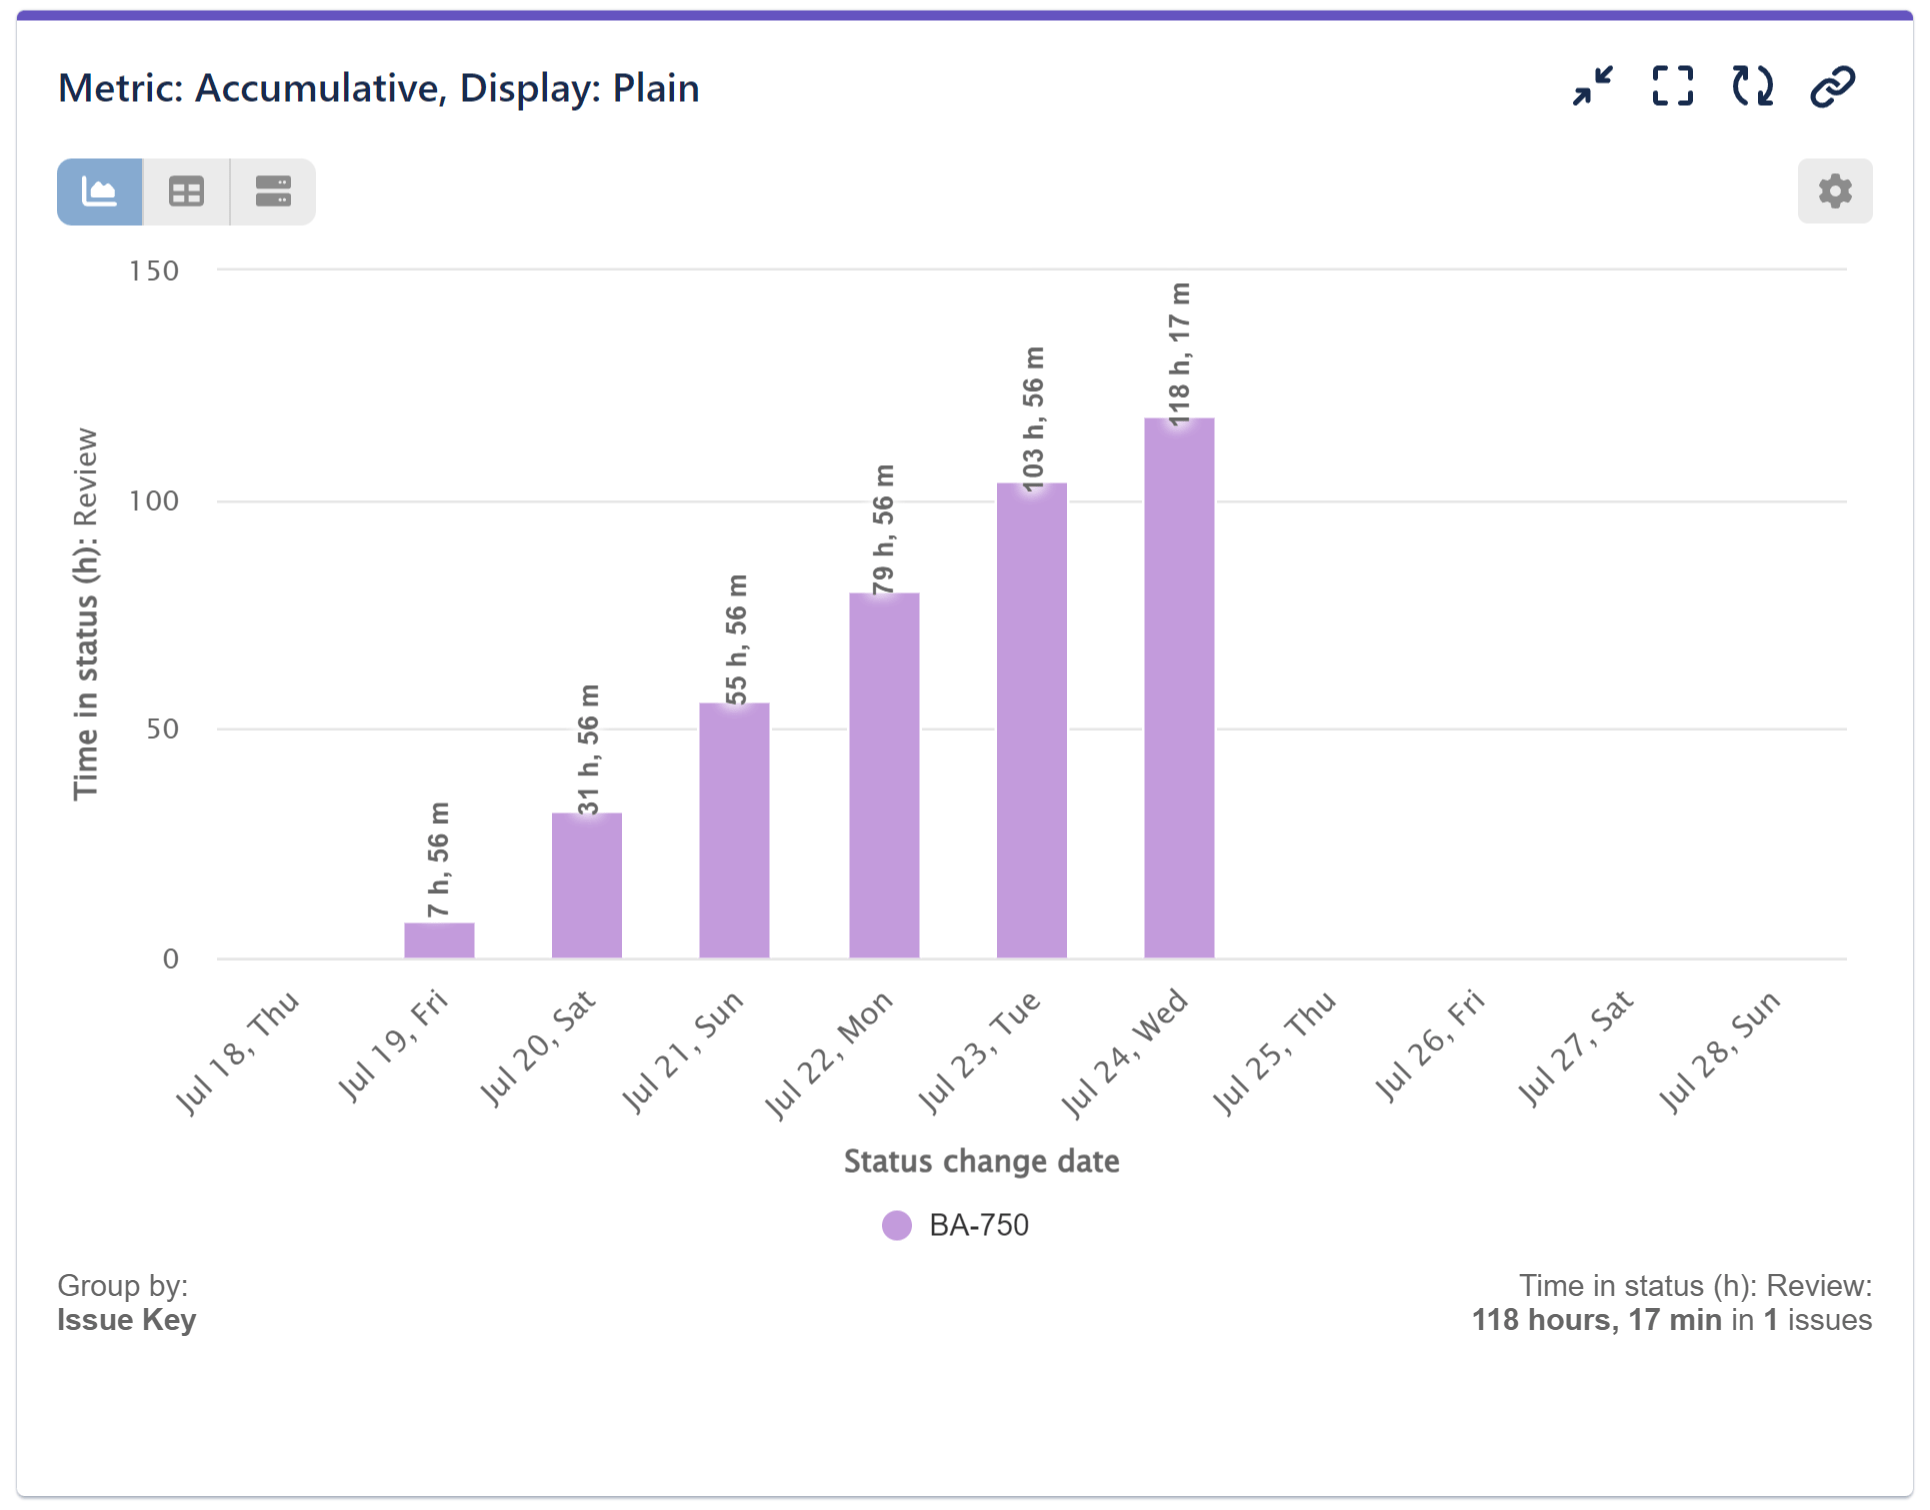
In the sample table and charts below, we have isolated a single issue with the key BA-750 to demonstrate how the app behaves in three configuration scenarios when ‘Display by’ is set to ‘Status change date’ by Day. This will also help you understand the difference between cumulative mode and the accumulative toggle.
- Accumulative Off, Plain Mode: Shows data broken down by the time in a day.
- Accumulative On, Plain mode: Shows accumulated time through the days until the last moment the issue was in the selected status, i.e. issue aging in status over time.
- Accumulative Off, Cumulative Mode: Refers to a sum of results over time by adding all previous days’ values.
- Accumulative On, Cumulative Mode: Applying this toggle in Cumulative mode is incorrect, so please avoid using them together.
Time in Status: Review (hours) for an issue that was in status ‘Review’ for 4d 22h with a 24/7 Work Calendar
| Issue B1-750 | Plain Mode | Accumulative On, Plain mode | Cumulative Mode |
| Day 1 | 8 | 8 | 8 |
| Day 2 | 24 | 32 | 32 |
| Day 3 | 24 | 56 | 56 |
| Day 4 | 24 | 80 | 80 |
| Day 5 | 24 | 104 | 104 |
| Day 6 | 14 | 118 | 118 |
| Day 7 | 0 | 0 | 118 |
As you can see, the choice of plain or cumulative mode, or accumulated calculation does not affect the total ‘Time in Status’; it only changes the visualization of the data on the chart.


To further explore related topics and metrics, you may find the following articles helpful: Cycles in status, Time in assignee, Cycles in assignee, Time between, Time since, Work calendars. These resources provide additional insights and guidance on utilizing various metrics to analyze and optimize your workflow.
Start your 30 days free trial of Performance Objectives: Charts for Jira from Atlassian Marketplace.