Table of Contents
Maximizing Insights with the Issue List View in Scatter & Bubble Gadget
The Performance Objectives app for Jira presents a helpful feature within its Scatter & Bubble Charts gadget – the Issue List View accessible through the Pivot Table toggle. This view delivers a comprehensive and detailed list of Jira issues, filtered and selected in your chart configuration, allowing teams to explore key metrics that impact workflow efficiency at a easy to read granular level.
While the default Issue List View includes essential details such as issue key and summary, it offers extensive customization options by enabling the addition of up to four dynamic metrics or fields. This high level of detail and insight helps teams tailor the view to their specific needs, facilitating the identification and resolution of critical issues more effectively. Below, we will showcase a sample use case report built with the Scatter & Bubble gadget in Pivot Table view to illustrate the depth of insights and benefits this feature provides.
While the Jira Issue Navigator is excellent for general issue management and filtering across all projects, our Issue List View is optimized for specific analytical tasks. It helps teams focus on key performance indicators within a specific report, making it easier to identify and address issues affecting project/sprint efficiency and task clarity.
Enhancing Agile Workflow with the Story Points and Workflow Analysis Report
The Story Points and Workflow Analysis Report is an excellent use case for the Issue List View, offering significant benefits to agile teams. This report analyzes key performance indicators such as story points, time in status “In Progress,” cycles in status “Review,” and the number of comments. By leveraging the Issue List View, teams can add these metrics directly to the list, alongside the issue key and summary.
With metrics like time in “In Progress” and cycles in “Review” displayed, teams can quickly spot outlier issues that may be causing delays. The list view allows for easy sorting and filtering, helping teams prioritize tasks that need immediate attention. By including the number of comments as a field in the list view, teams can identify tasks that required extensive clarification, often a sign of unclear requirements. This helps in refining requirement documentation for future sprints.
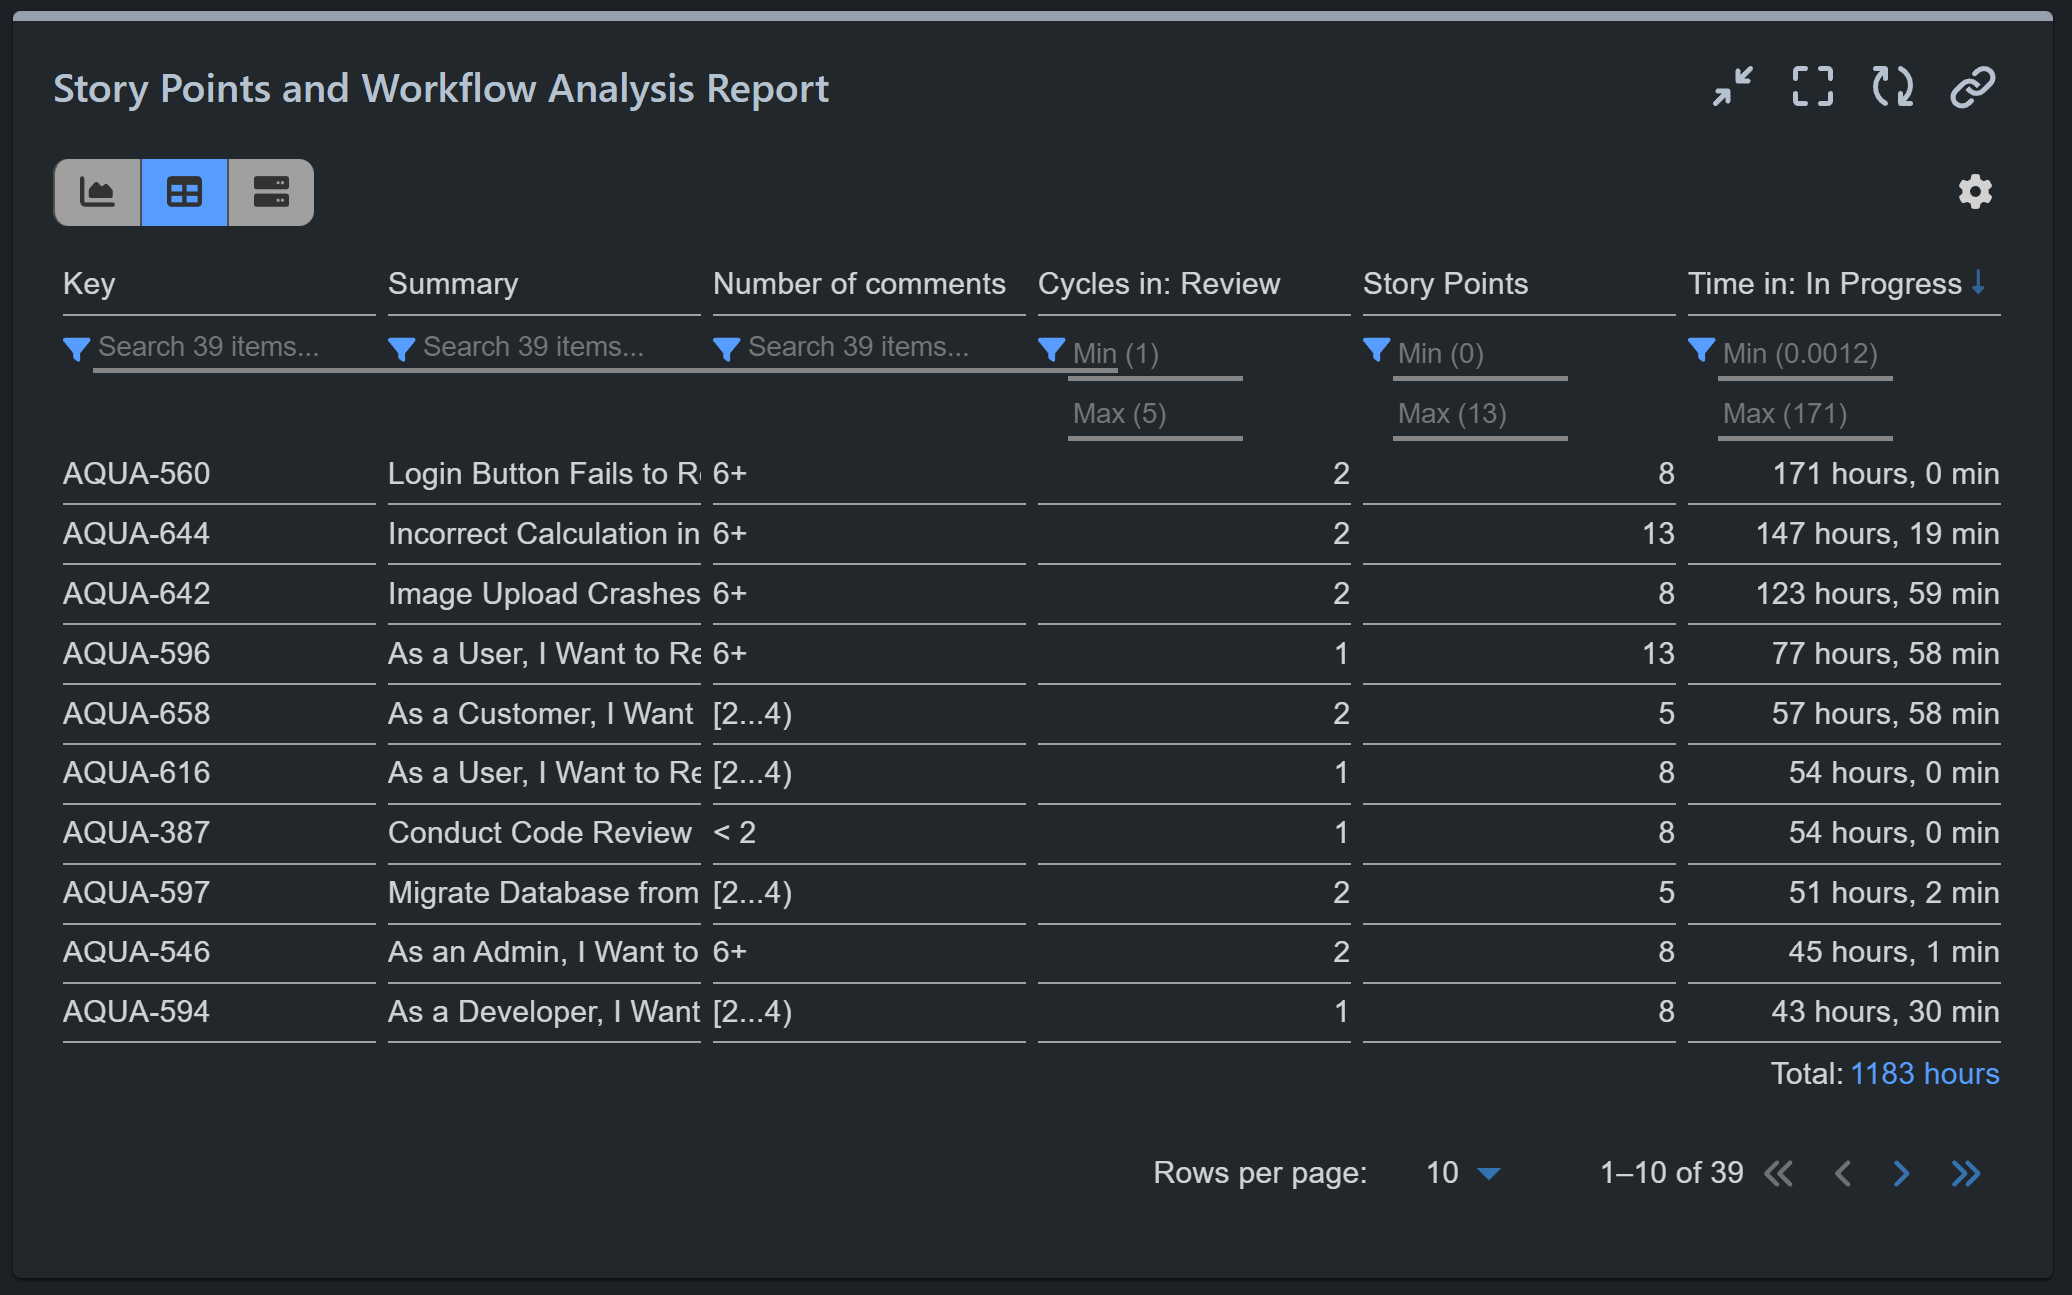
The ability to sort (ascending or descending) and filter based on specific value ranges (min and max) allows teams to make informed decisions about where to focus their improvement efforts. Whether it’s addressing tasks with excessive review cycles or reducing communication bottlenecks, the Issue List View empowers teams to act on real data.
Here are the configuration steps for this report:
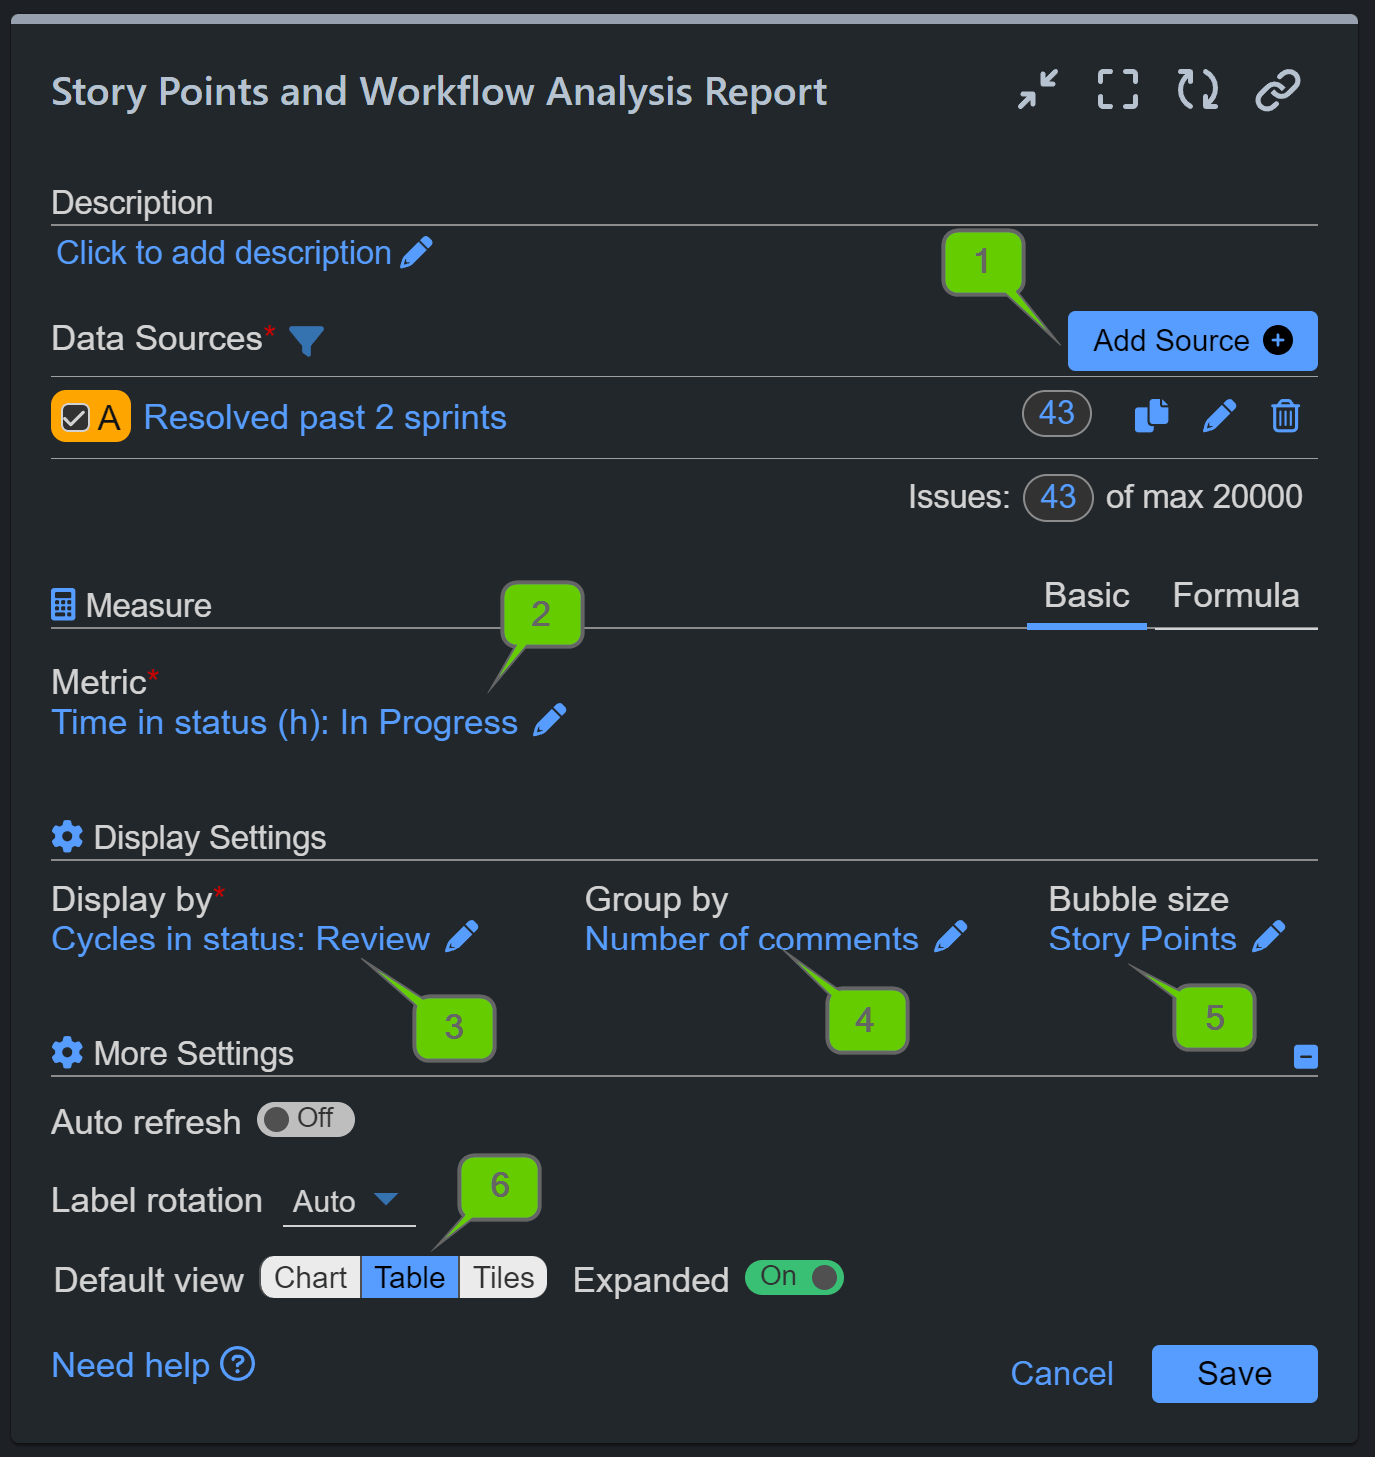
Step 1: In the Data Source, filter for resolved issues within the desired project and time period you wish to analyze.
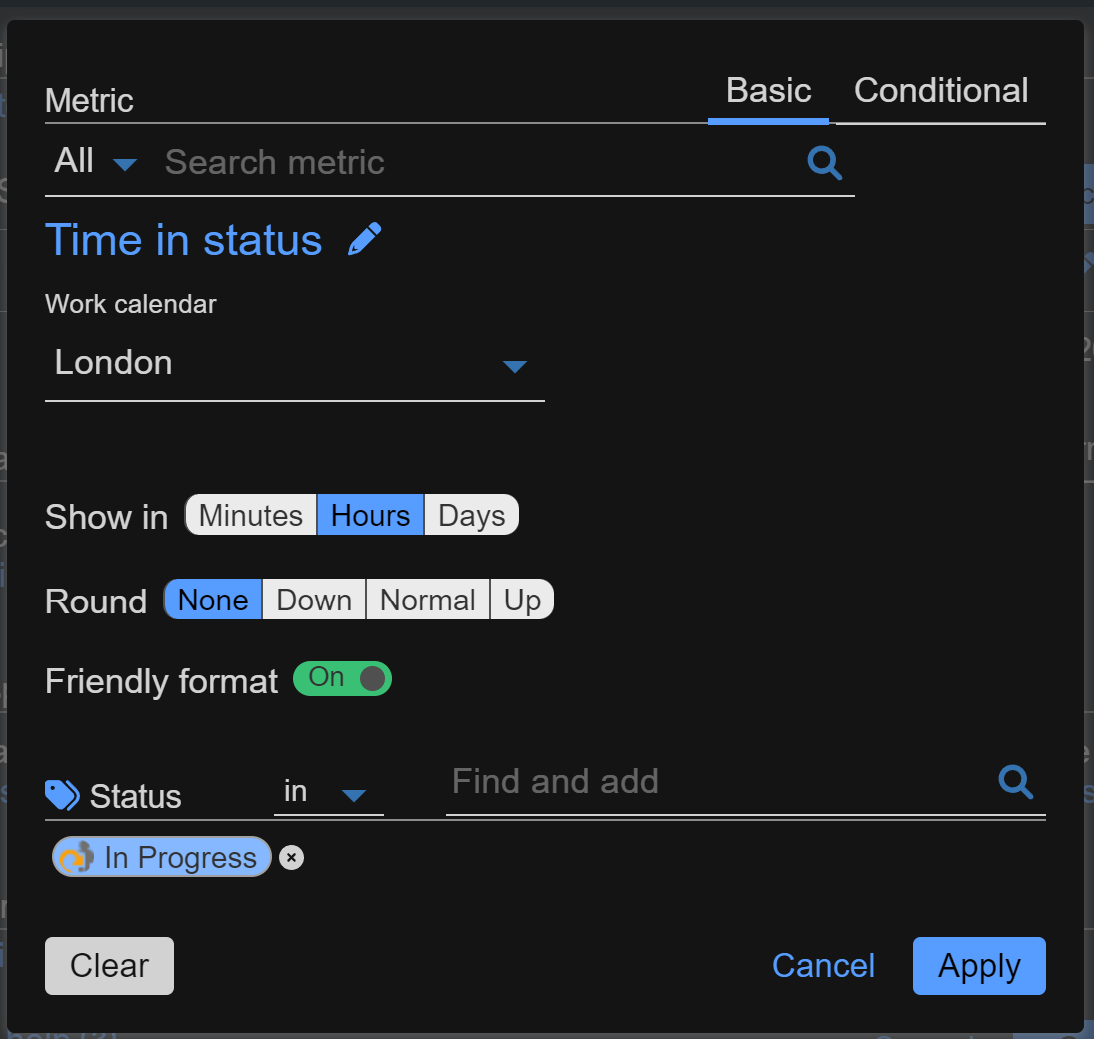
Step 2: Select the ‘Time in Status’ metric, specifying the “In Progress” status and a work calendar to ensure accurate time tracking.
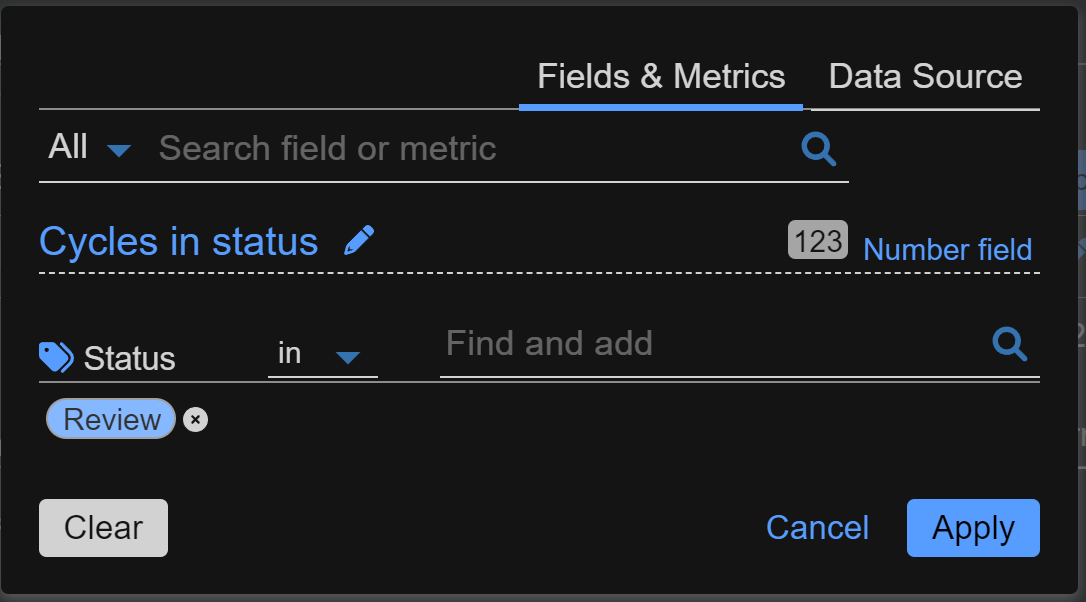
Step 3: For Display By, choose the ‘Cycles in Status’ metric and set the status to “Review.”
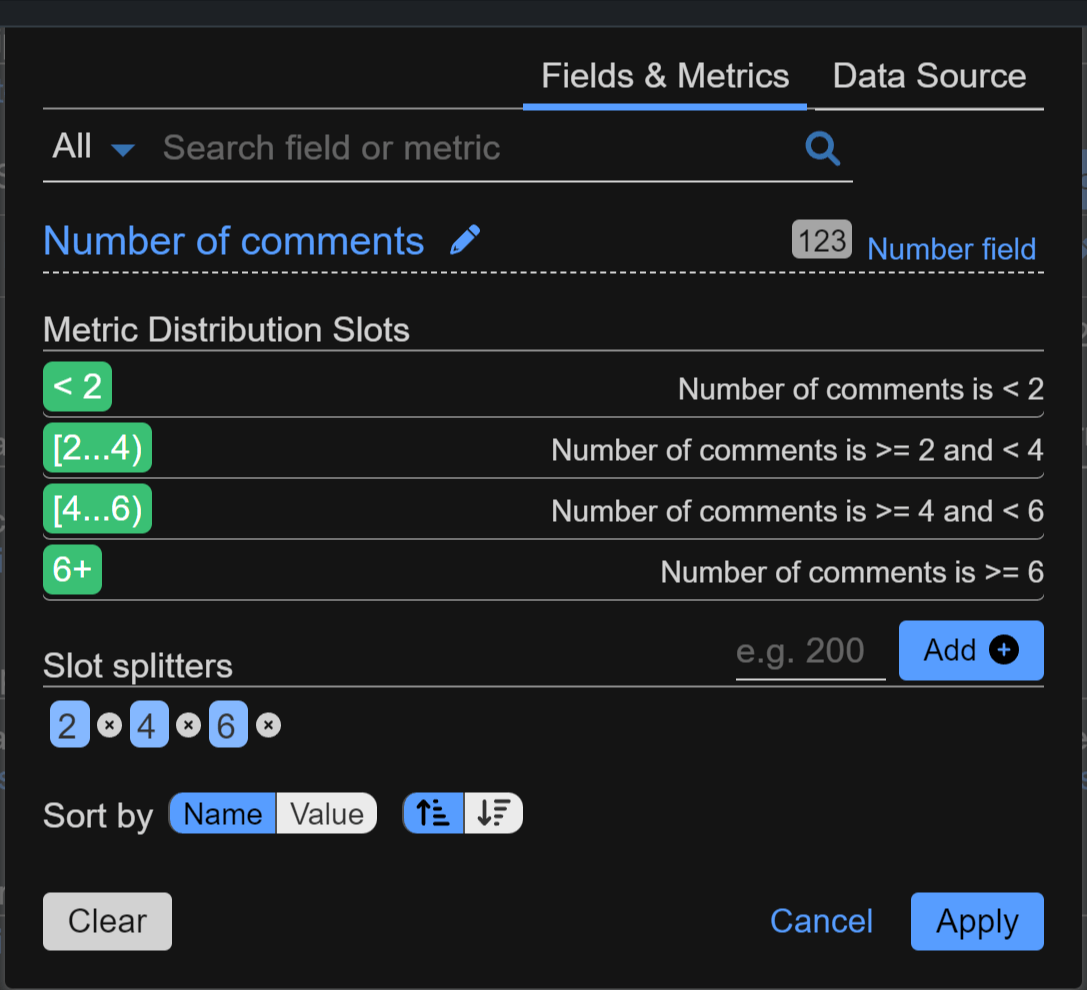
Step 4: For Group By, select the ‘Number of Comments’ metric and define distribution slots according to your reporting needs. In this example, we have divided the groups as follows:
- Comments below 2
- Comments between 2 and 4
- Comments between 4 and 6
- Comments above 6
Step 5: For Bubble Size, select the ‘Story Points’ metric.
Step 6: Under More Settings, specify that the default view for this report should be the Pivot Table.
Here are detailed images for steps 2,3, and 4:
For more information on how to leverage the Scatter Plot and Bubble Chart gadget, including detailed use cases and setup instructions, please refer to our comprehensive guide on these powerful data visualization tools.
Start your 30 days free trial of Performance Objectives: Charts for Jira from Atlassian Marketplace.